
Figures & data
Figure 1. Surface and cross-section of samples 1–10 magnified 1000 times.
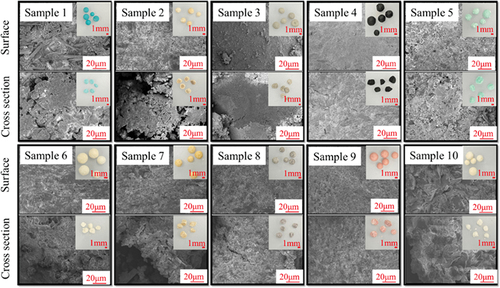
Figure 2. XRD spectra of samples 1–10.
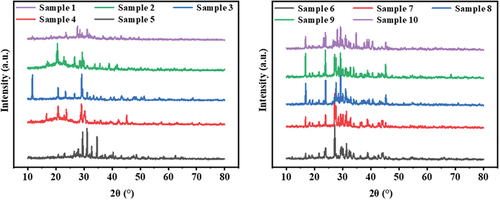
Figure 3. The dispersion of sample 1 in water after sieving with meshes of different numbers.
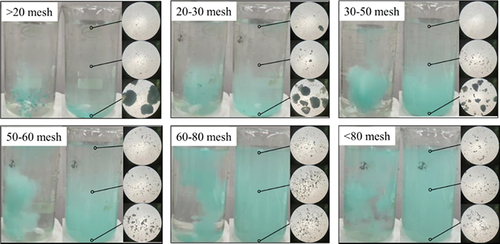
Figure 4. Disintegration degree of samples 1–5 with the time (a), temperature (b) and the fertilizer to water ratio (c).
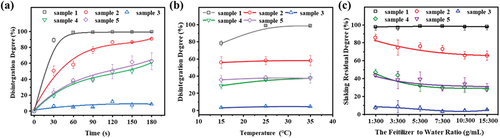
Figure 5. Different stacking modes studied using sample 1.
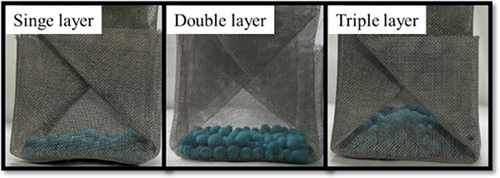
Figure 6. Disintegration degree of samples 1–5 depending on the stacking mode (a) and diameter (b).
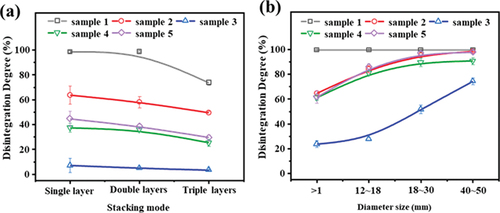
Figure 7. Sample 1–5 test histograms of 30 sets of data using the mass disintegration method.
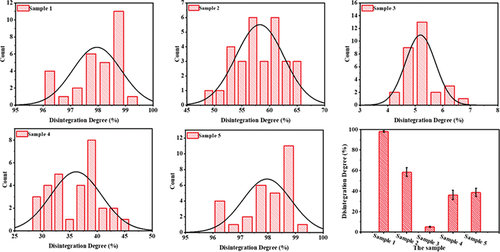
Figure 8. (a) dissolution degree of samples 6–10; (b) the contrast between dissolution and disintegration for samples 6–10.
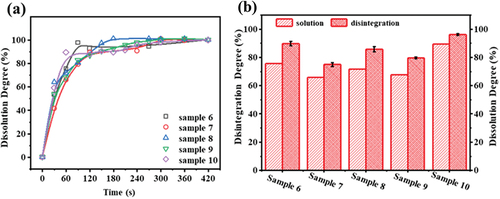
Figure 9. (a) dimensions of slings; (b) drawing of hanging basket; (c) photograph of hanging basket.
Table 1. Statistical analysis of testing result of sample 1–5.