
Figures & data
Figure 1. The location of the soil profile and management system in Neyshabur plain, northeastern Iran.
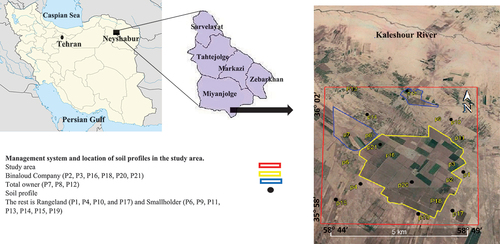
Figure 2. The illustrated procedure of study including date base preparation, data analyses (land suitability and soil quality calculation) and validation the result.
Table 1. The number of depth sections and weight coefficients for soils with different depths (Sys et al. Citation1991).
Table 2. Descriptive statistics of the soil properties in the study area.
Table 3. Mean values properties of the representative soil profiles in different management systems.
Table 4. Results of four principal component analysis of the surface soil properties affecting soil quality.
Table 5. Results of five principal component analysis of the soil profile properties (weighting factor) affecting soil quality.
Table 6. Results of four principal component analysis of the soil profile properties (weighted mean) affecting soil quality.
Table 7. Soil quality index of the different management units in the MDS.
Table 8. Land suitability for alfalfa in the study area.
Figure 3. Relationship between the observed yield and predicted yield in the management systems.
Table 9. Regression relationship between surface and profile soil quality index with observed yield of alfalfa in the MDS.
Figure 4. Relationship between the observed yield and land index in the management systems.
