Figures & data
Table 1. Information about two experiments conducted in the research greenhouse. (DAT: days after transplanting).
Figure 1. Changes of total dry matter (TDM), total leaf area (TLA), leaf area duration (LAD) and accumulated nitrogen (N) concentration under different N treatments during the first and second experiments.
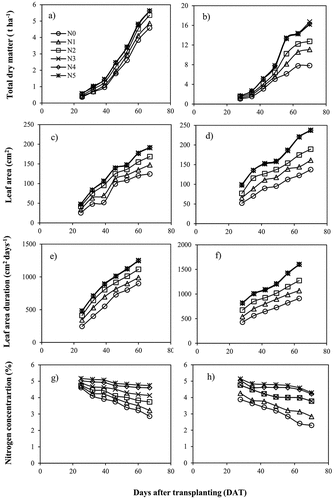
Figure 2. Critical nitrogen (N) data points used to determine critical nitrogen dilution curves (CNDCs) for lettuce based on a) Total dry matter (TDM), b) Total leaf area (TLA) and c) Leaf area duration (LAD).
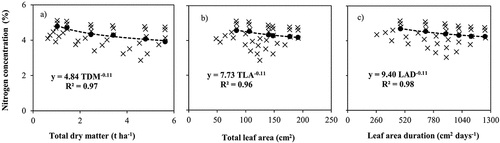
Figure 3. Validation of the critical nitrogen dilution curves using the independent data set from the second experiment.
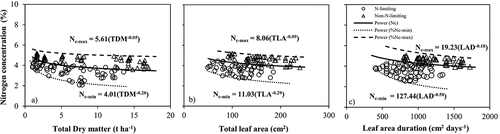
Figure 4. Changes in the nitrogen nutrition index (NNI) and integrated NNI (NNIint) under different nitrogen application rates for a) total dry matter-first experiment, b) total dry matter-second experiment, a) Total leaf area-first experiment, a) Total leaf area- second experiment, a) lLeaf area duration-first experiment and a) Leaf area duration-second experiment.
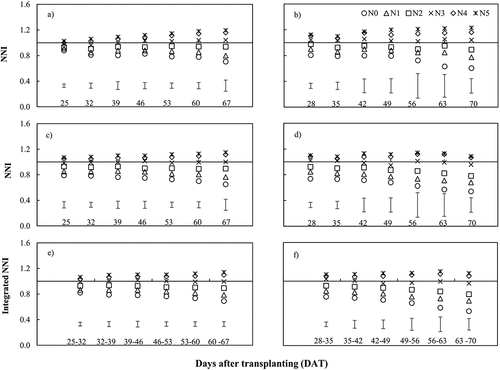
Figure 5. Relationship between relative dry matter (RDM) and nitrogen nutrition index (NNI) for lettuce during both experiments. The NNI was the average value over all sampling dates.
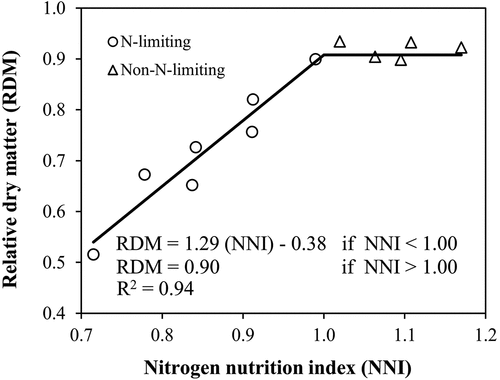
Figure 6. Comparison of lettuce critical nitrogen dilution curve developed in the present study with previously developed ones.
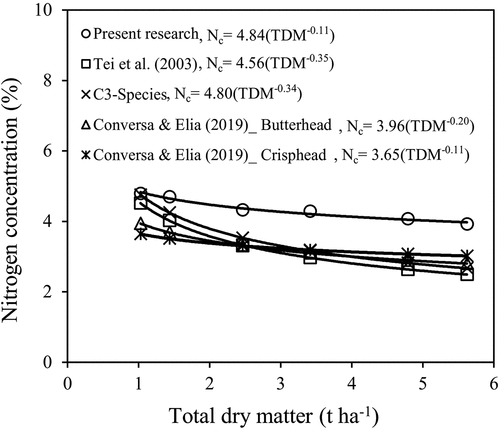
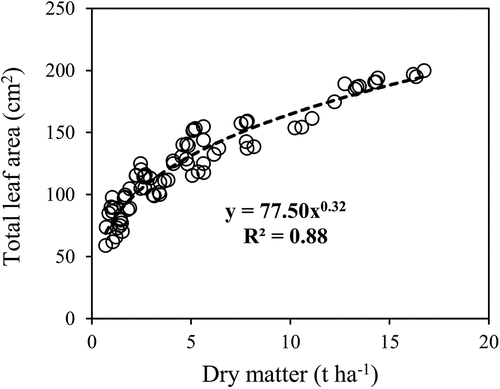
Figure 7. Allometric relationship between lettuce total dry matter and total leaf area of the first and second experiments data.