
Figures & data
Figure. Monthly average rain fall, maximum and minimum temperature of the experimental sites during the year 2021. DZ = Debre Zeit, CD = Chefe Donsa and MJ = Minjar.
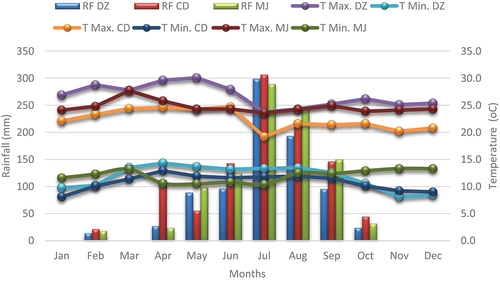
Table 1. Soil chemical and physical properties of experimental locations.
Table 2. Description of durum wheat genotypes used for the experiment.
Table 3. Mean squares, means and coefficients of variation from the combined analysis of variance of grain yield (GYD) and N use efficiency components of durum wheat genotypes under high and low N conditions over three locations.
Table 4. Mean grain yield and above ground biomass N yield of6 durum wheat genotypes over the three locations.
Figure 2. Average grain yields (a) and above ground biomass N yield (b) of durum wheat genotypes at the three experimental sites under low and high N growth conditions (the different small and capital letters indicate the presence of significant difference between sites under low N and high N, respectively).
Figure 3. Average N uptake efficiency (NUpE) of durum wheat genotypes across the three locations under high and low N (the different small and capital letters indicate the presence of significant difference between sites under low N and high N, respectively).
Figure 4. Average nitrogen harvest index (NHI) values across the three locations of durum wheat genotypes under high and low N growth conditions (the different small and capital letters indicate the presence of significant difference between sites under low N and high N, respectively).
Table 5. Mean nitrogen utilization efficiency (NUtE) and nitrogen use efficiency (NUE) of6 durum wheat genotypes over the three locations.
Figure 5. Average nitrogen utilization efficiency (a) and nitrogen use efficiency (b) of durum wheat genotypes at the three experimental sites under low N and high N growth conditions (the different small and capital letters indicate the presence of significant difference between sites under low N and high N, respectively).
Figure 6. Relative proportions of grain and straw N uptake by durum wheat genotypes under (a) Low N and (b) High N supply.
Table 6. Simple correlation coefficients among yield and nitrogen use efficiency component variables of durum wheat genotypes under high N (upper diagonal) and low N (below diagonal) conditions.
Figure 7. GGE biplot for six environments and grain yield of6 durum wheat genotypes tested under low and high N conditions at three locations. The numbers–16 indicate the genotype codes. DZLN = Debre Zeit under low N, DZHN = Debre Zeit high N, CDLN = Chefe Donsa low N, CDHN = Chefe Donsa high N, MJLN = Minjar low N and MJHN = Minjar high N.
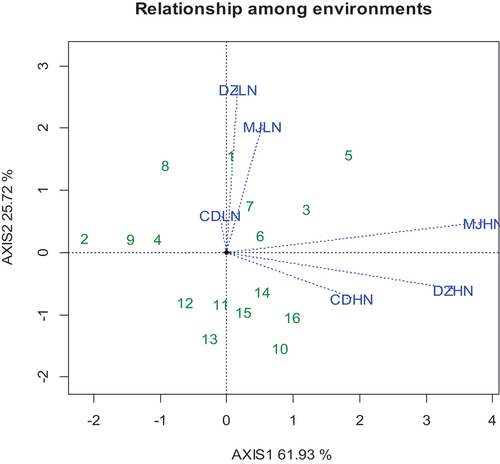
Figure 8. Adaptability and performance of durum wheat genotypes with respect to test environments. The numbers–16 indicate the genotype codes. DZLN = Debre Zeit under low N, DZHN = Debre Zeit high N, CDLN = Chefe Donsa low N, CDHN = Chefe Donsa high N, MJLN = Minjar low N and MJHN = Minjar high N.
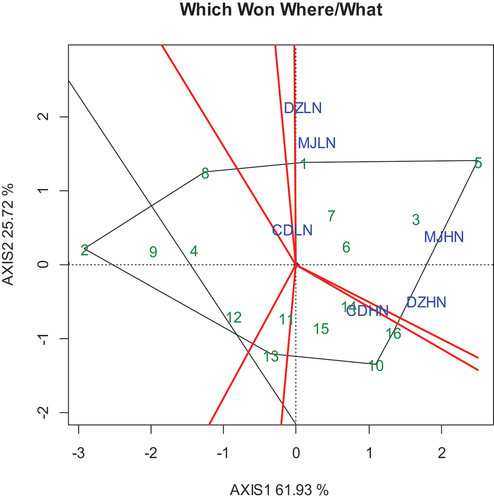
Table 7. Mean grain yield, AMMI stability value and yield stability index for the6 durum wheat genotypes tested across the six environments.
Supplemental Material
Download PDF (175.2 KB)Data availability statement
The data presented in this study are available upon request from the corresponding authors.