Figures & data
Table 1. Effects of different long-term fertilizer treatments on rhizosphere soil N transformation rates in the double-cropping rice fields.
Figure 1. Effects of different long-term fertilizer treatments on rhizosphere soil enzyme activities in a double-cropping rice field (a) was soil urease; (b) was soil protease; (c) was soil β-glucosaminidase; (d) was soil arginase.
Figure 2. Effects of different long-term fertilizer treatments on rhizosphere soil relative abundances of Proteobacteria, Acidobacteria and Actinobacteria in the double-cropping rice fields (a) was Proteobacteria; (b) was Acidobacteria; (c) was Actinobacteria.
Table 2. Effects of different long-term fertilizer treatments on abundance of sub, npr, chiA and ureC in rhizosphere soil under the double-cropping rice system.
Figure 3. Effects of different long-term fertilizer treatments on alpha diversity of rhizosphere soil bacterial community in the double-cropping rice fields (a) was Chao 1; (b) was observed OTUs; (c) was Shannon.
Figure 4. Nonmetric multidimensional scaling (NMDS) ordination (stress = 0.1) of the weighted UniFrac distance for rhizosphere soil bacterial community with different long-term fertilizer treatments.
Figure 5. Log2-fold change in relative abundance of OTUs compared with those of the control treatment in rhizosphere soil.
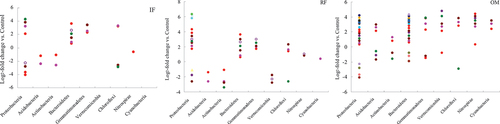
Figure 6. Effects of different long-term fertilizer treatments on relative abundance of rhizosphere soil bacterial community in the double-cropping rice fields (a) relative abundances of the dominant phyla (>1%) for bacterial ureC. (b) Nonmetric multidimensional scaling (NMDS) ordination (stress = 0.09) of the weighted UniFrac distance for bacterial ureC under four fertilizer treatments. (c) Relative abundances of the dominant phyla (>1%) for bacterial chiA. (d) Nonmetric multidimensional scaling (NMDS) ordination (stress = 0.05) of the weighted UniFrac distance for bacterial chiA under four fertilizer treatments.
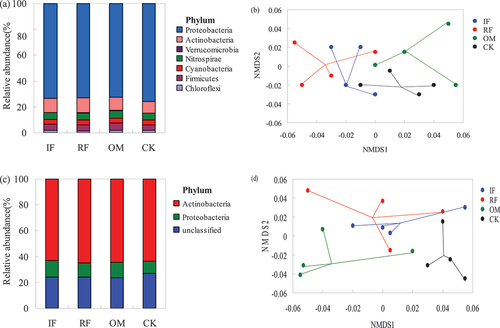
Figure 7. Maximum-likelihood tree of top 50 most abundant partial ureC OTUs.
Figure 8. Maximum-likelihood tree of top 50 most abundant partial chiA OTUs.