
Figures & data
Table 1. Demographics of the qualitative sample
Figure 1. Bar chart reporting the types of diets followed by questionnaire respondents
Figure 2. Word cloud depicting the most frequent words associated with healthy eating that participants wrote on the board during the interviews
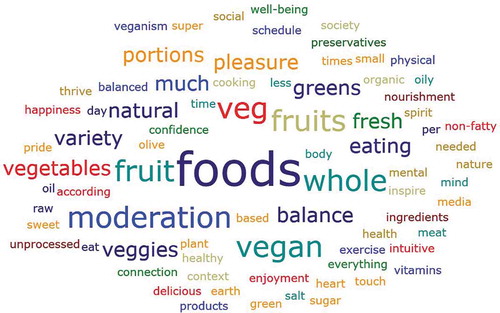
Table 2. Bio-psycho-social drivers to eat healthy found during interviews
Figure 3. Plot reporting means and 95% confidence intervals of the scores obtained for each determinant by questionnaire respondents
Figure 4. Frequency distribution of ORTO-15 scores of questionnaire respondents. The dashed-red line indicates the threshold below which the ORTO-15 would have assessed orthorexia nervosa
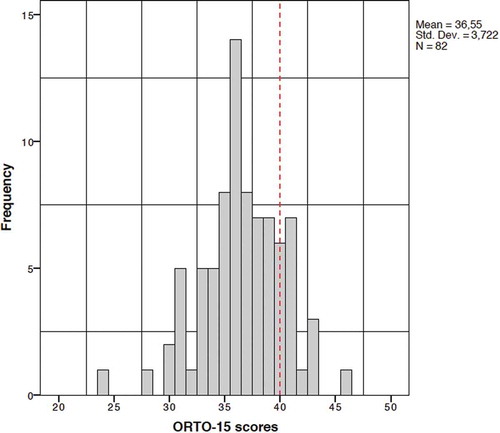
Table 3. Regression analysis summary (ORTO-15)
Table 4. Regression analysis summary (ORTO-6)