Figures & data
Figure 1. a: Epicentres of earthquakes of magnitude 2 or greater recorded in eastern South Australia until 2016 (from Preiss, Citation2019). b: locality map of the Noarlunga Embayment on the eastern side of Gulf St Vincent south of Adelaide (modified from Smith et al., Citation2016). c: satellite view showing the en echelon splay faults at the southern end of the Adelaide fold belt and the Noarlunga and Willunga Embayments (modified from Sandiford, Citation2003). The Witton Bluff coastal cliffs lie towards the northern limit of the sedimentary fill of the Noarlunga Embayment.
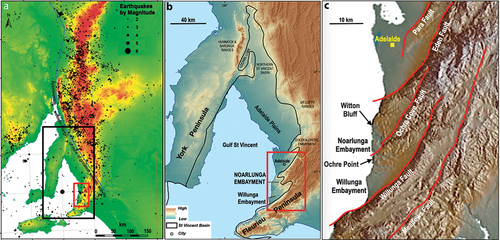
Figure 2. a: N–S coastal transect across the Noarlunga and Willunga Embayments showing locations of the cliff sections in relation to the geology, including the main faults defining the southern margins of the embayments (May & Milnes, Citation2024). Trend-lines represent bedding in Cenozoic sediments; vertical lines represent Neoproterozoic bedrock (modified from McGowran et al., Citation2016). b: view of the cliff section from Witton Bluff southwards. Late Eocene Blanche Point Formation (white) crops out just above beach level at the base of the cliff. The unconformably overlying Pleistocene non-marine sequence is brown-coloured. (Google earth image).
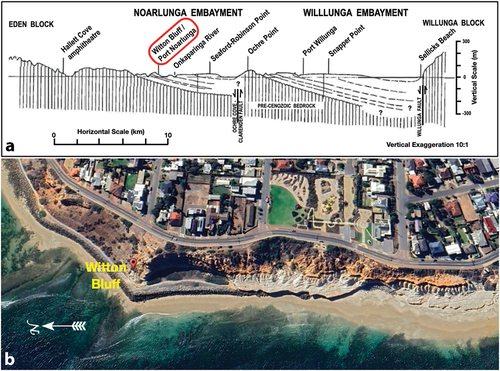
Figure 3. Stratigraphic sequence in the cliff sections in the immediate vicinity of Witton Bluff. a: just south of the Bluff: Robinson Point Formation gravels and sands unconformably overlie late Eocene Blanche Point Formation limestones and siliceous marls. A concretionary carbonate horizon separates the Robinson Point Formation from the overlying reddish Neva Clay Member of the Ngaltinga Formation and a carbonate blanket and surface soil. b: north of Witton Bluff, Robinson Point Formation gravels and sands with an interbed of Burnham Limestone below a pink haematitic zone of alunite-halloysite alteration. Thickly bedded sands, Fe-mottled, extend almost to the carbonate blanket at the top of the section. c: thinly bedded Robinson Point Formation sands at the bottom of the section; thick sand unit with significant soft-sediment deformation above. Note disrupted blocks of thinly bedded sand scattered throughout an unstructured sand matrix. Carbonate blanket caps the section.
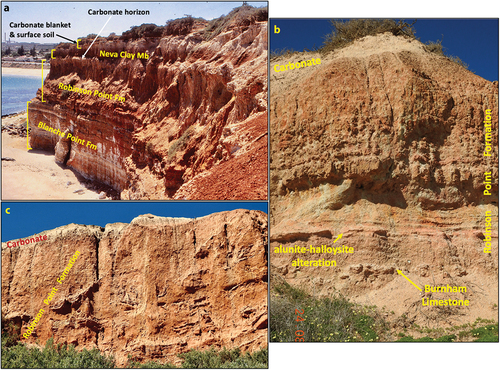
Figure 4. Composite sketch of the Pleistocene succession in the coastal cliffs between Witton Bluff and Port Noarlunga (after May, Citation1992) with photographs of representative lithologies.
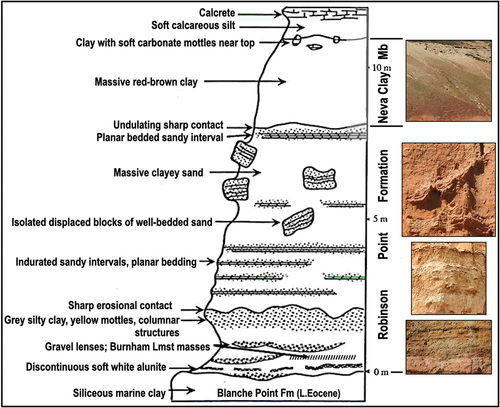
Figure 5. a: Well-bedded sands (wb) deformed into a thixotropic bowl isolated within fluidised clayey sand (fs); near Port Noarlunga. b, c: depictions of the lower unit of disturbed well-bedded sands in the Robinson Point formation displaying cavernous weathering; near Port Noarlunga. Thixotropic wedges (tw) are indicated. d: thixotropic wedge (for comparison with b, c) in Pleistocene littoral calcarenite seismite from Calabria, Italy (from Montenat et al., Citation2007).
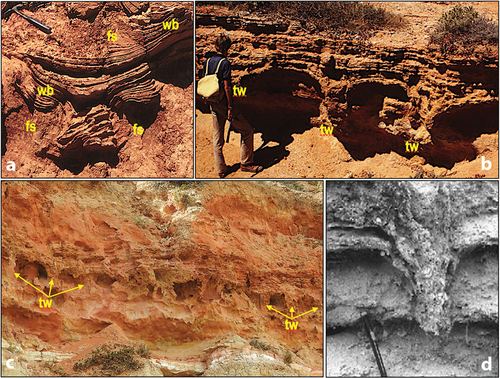
Figure 6. Isolated blocks of well-bedded sands floating within a surrounding matrix of structureless clayey sand injected along fluidisation conduits (dashed yellow arrows). Note step-faulting of indurated sands in a (dashed blue lines). White dotted lines in b & c indicate bedding trends. White dashed lines in b indicate faults. a, b: from near Port Noarlunga. c: from Witton Bluff. d: Fluidisation conduit in sandy late Messinian seismite from Alicante, Spain (from Montenat et al., Citation2007).
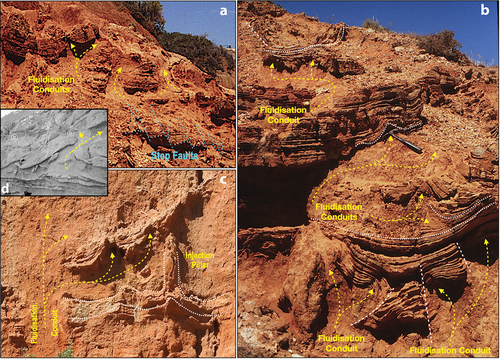
Figure 7. Injection of fluidised sand slurry (yellow arrows) deforming and/or isolating blocks of well-bedded sand, Witton Bluff.
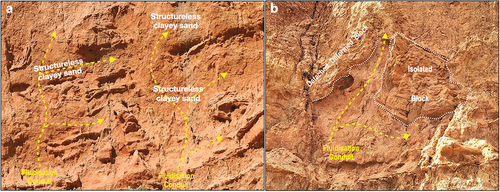
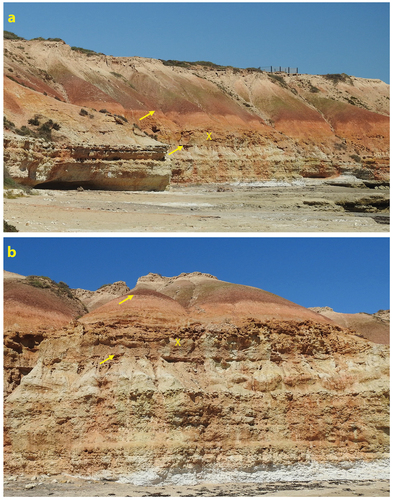
Figure 8. General view of the cliff face near Port Noarlunga showing intense liquefaction-induced soft-sediment deformation disrupting horizon X throughout the sequence above horizon Y, including listric slump faulting (white dashed lines). The cavernous weathering within the indurated unit capped by horizon Z is indicative of distorted bedding while the sequence between horizons Y and Z displays thin layers of soft-sediment deformation between well-bedded layers.
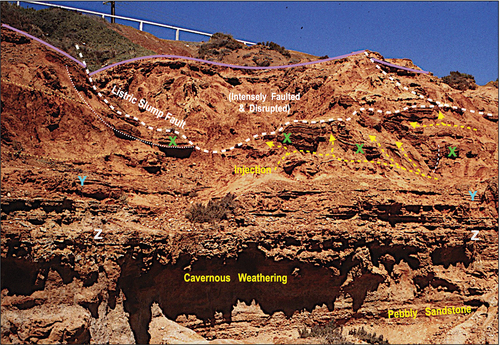
Figure 9. Views of the liquefaction deformation interval (X) in the cliff section south of the Onkaparinga River mouth, southern Noarlunga Embayment. The unconformity marking the top of the Late Eocene Blanche Point Formation and the base of the Robinson Point Formation is indicated by the lower arrow, while the upper arrow indicates the base of the Neva Clay Member of the Ngaltinga Formation. A white carbonate blanket is at the top of the section.