Figures & data
Figure 1. The distribution of study sites in relation to the continent’s aridity, the African Superswell as well as major fault lines and major rivers (Source of fault lines: Pik et al., Citation2006).
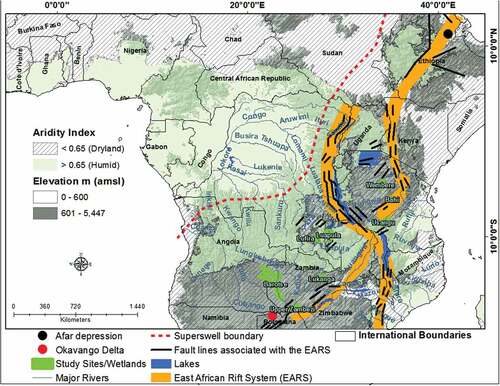
Figure 2. LandsatLook images of (a) the Lufira wetland on 5 November 2014, (b) the Barotse wetland on 28 April 2015 and (c) the Upper Zambezi wetland on 17&24 October 2013. Graphs (a1), (b1) and (c1) show valley cross sectional profiles of lines 1 to 5 in (a), (b) and (c) respectively with cross sectional profile 5 in (a1) plotted against the secondary axis. Google Earth imagery (a2) and (b2) are enlarged areas in (a) and (b) respectively (Source: Google Earth’s DigitalGlobe and CNES/Airbus).
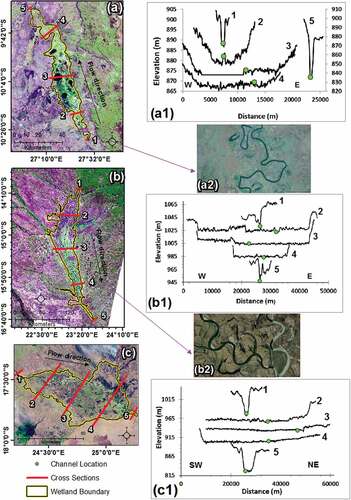
Figure 3. Channel longitudinal profiles including the location of wetlands, lakes and waterfalls, with (a) showing that of the Lufira River and (b) showing that of the Zambezi River.
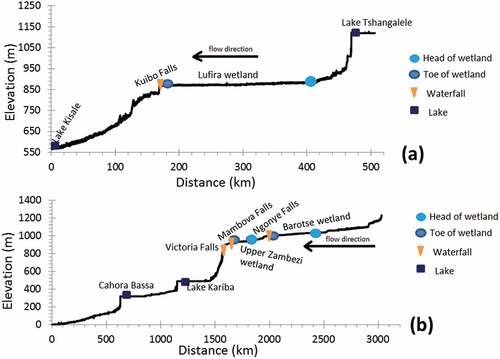
Figure 4. Catchment geological maps, with (a) showing the geological map of Lufira wetland’s catchment, with (b) showig the catchment of the Barotse and Upper Zambezi wetlands. Inserts (a1), (b1) and (b2) show the geological characteristics at the toe of the Lufira, Barotse and Upper Zambezi wetlands respectively.
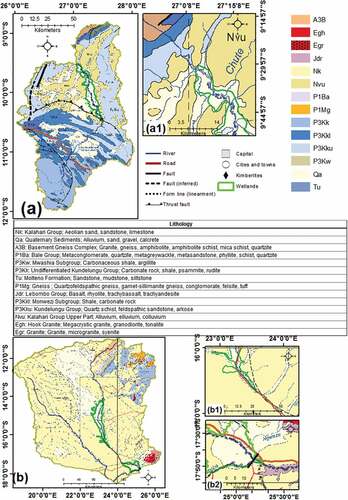
Figure 5. The topography and fault lines around (a) Bahi, (b) Wembere, and (c) Usangu wetlands. Graphs (a1) to (c1) show the elevation profiles of lines 1 and 2 in (a) to (c1) respectively.
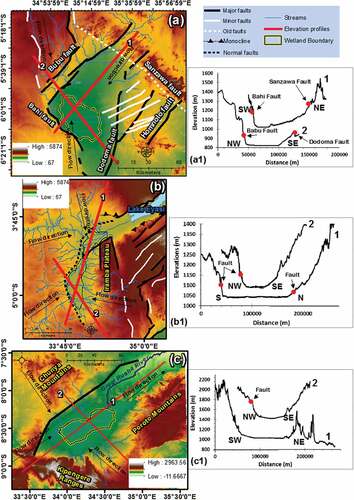
Figure 6. Catchment geological maps, with (a) to (c) showing the catchments of Bahi, Wembere and Usangu wetlands’ catchments respectively.
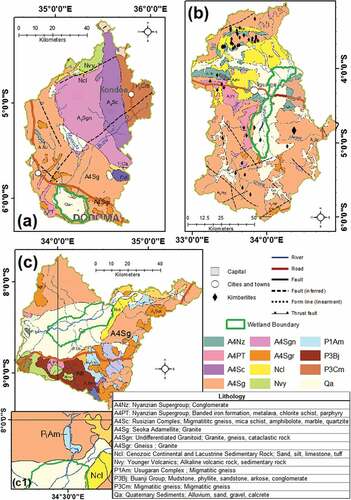
Figure 7. Wetland topographic characteristics, with (a) and (a1) showing topographic characteristics around the Upper Zambezi wetland and (a2) shows the elevation profile of the blue line in (a1). The LandsatLook images (16&23 September 2006) in (b) and graph (b1) shows the southern section of the Wembere wetland and the elevation profile of lines 1 to 5 in (b), and (c) shows drainage networks within the Usangu wetland and the Great Ruaha River Catchments.
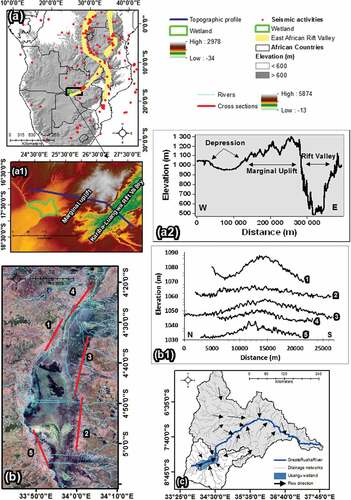
Figure 8. Conceptual model of wetland formation showing a relationship between hydrology, edaphic and biotic characteristics of wetlands (modified after Gosselink & Turner, Citation1978 and Mitsch & Gosselink, Citation2015).
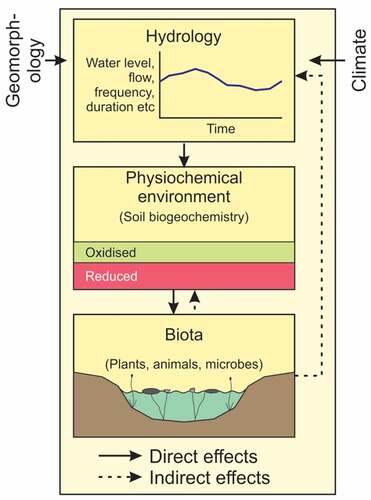
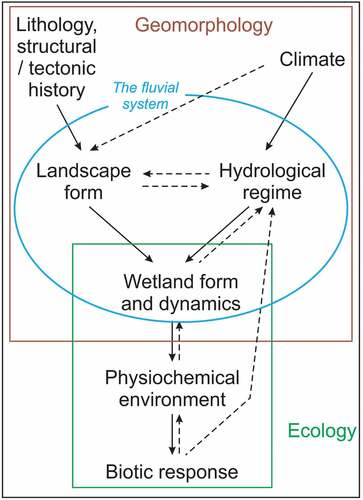
Figure 9. Conceptual model of wetland formation showing the influence of hydrology on wetland structure and function, and the biotic feedbacks that affect wetland hydrology as a result of the interaction between geomorphology, climate and human activities (modified from Tooth et al., Citation2015).
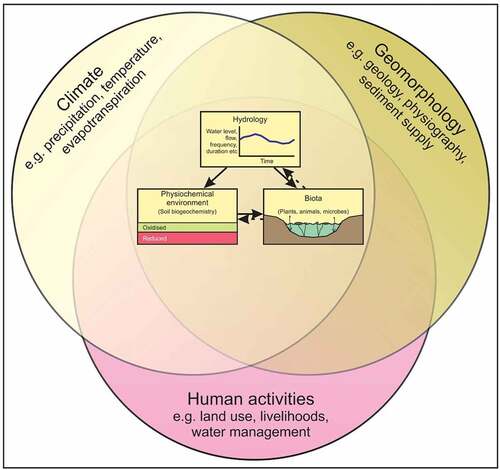
Figure 10. Conceptual model of wetland formation showing the role of geomorphological processes on wetland formation while incorporating the influence of prolonged flooding on the physiochemical and biotic characteristics of a wetland.