Figures & data
Figure 1. Map of South Africa and neighbouring countries, showing elevation.
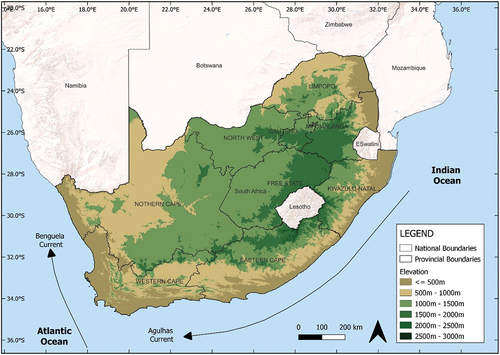
Figure 2. Map of South African provinces and the average start week of the influenza season between 2008–2019 (data from Motlogeloa et al., Citation2023).
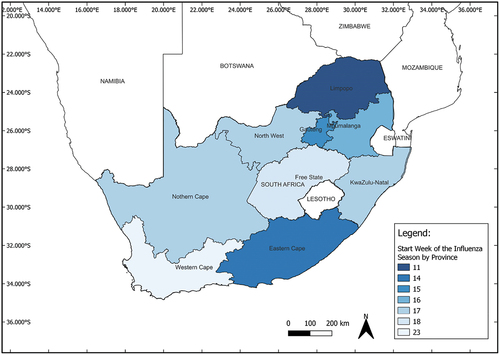
Table 1. Exclusion and inclusion criteria for the database.
Figure 3. Flow chart of the search results, and the inclusion and exclusion filtering.
Figure 4. Examples of quotes from newspaper reports on influenza from the rand daily mail. a) sports reporting from 16 June 1954, b) personal advertisements from 11 May 1917, c) political reporting from 24 July 1907 and d) Spanish influenza reporting from late 1918.
Figure 5. Total number of newspaper reports per year of the study period.
Figure 6. Total number of newspaper reports by week of the year over the study period.
Figure 7. The annual influenza season applying a 20% seasonal threshold.
Figure 8. Types of weather and climatic conditions mentioned in influenza reporting.
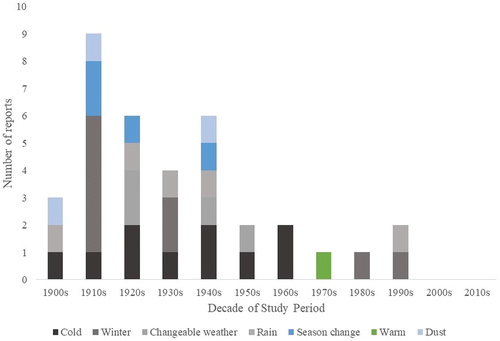
Figure 9. Examples of reporting on different weather conditions. a) cold snap from 1 July 1919 b) warm winter conditions from 21 July 1948 c) dust as a cause of influenza on 1 July 1919 and d) rain as a cause of influenza cases 3 June 1925.