Figures & data
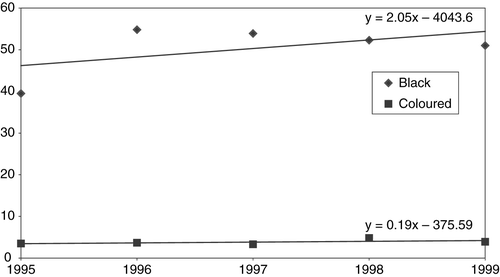
Figure 1 Percentage of Black and Coloured households living in huts or shacks in urban areas of the Western Cape province, 1995–99 (per cent)

Table 1 Type of dwelling occupied by urban and rural households in the Western Cape province, by race, 1995–1999 (percentage distribution)
Table 2 Sanitary facilities for urban and rural households in the Western Cape province, by race, 1995–99 (percentage distribution)
Table 3 Main source of water for urban and rural households in the Western Cape province, by race, 1995–99 (percentage distribution)
Table 4 Availablity of electricity for lighting among urban and rural households in the Western Cape province, by race, 1995–99 (percentage distribution)
Table 5 Labour force participation among urban and rural heads of households in the Western Cape province, by race and sex, 1995–99 (percentage distribution)
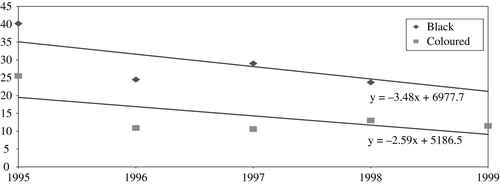
Figure 2 Unemployment among Black and Coloured female heads of households in urban areas of the Western Cape province, 1995–99

Table 6 Unemployment among urban and rural heads of households in the Western Cape province, by race and sex, 1995–99 (per cent)
Table 7 Reason given for unemployment by urban and rural heads of households in the Western Cape province, by race and sex, 1995–99 (per cent)
Table 8a Educational attainment of male urban heads of households in the Western Cape province, by race, 1995–99 (percentage distribution)
Table 8b Educational attainment of urban female heads of households in the Western Cape province, by race, 1995–99 (percentage distribution)
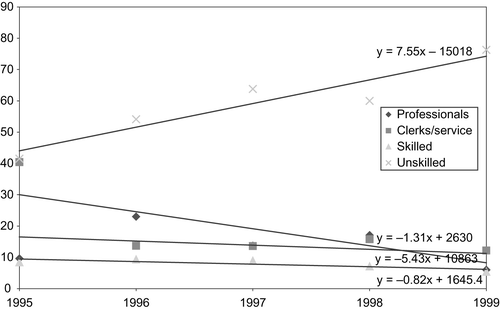
Figure 3 Occupations of black female heads of households in urban areas of the Western Cape province, 1995–99 (per cent)
