Figures & data
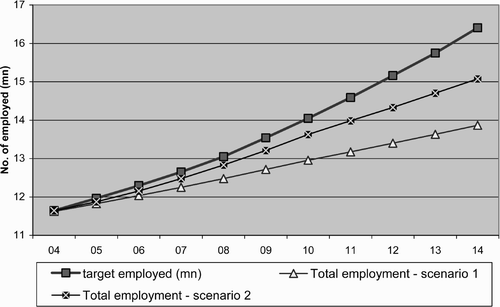
Figure 1: Meeting targets at different rates of employment growth
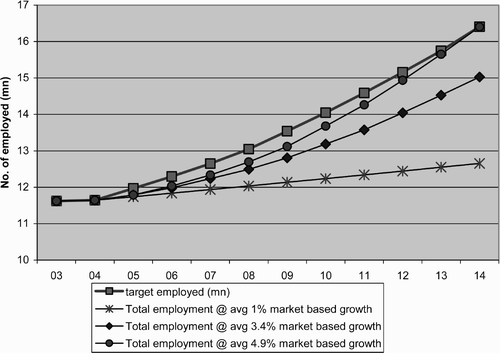
Figure 2: Formal employment by sector. Source: StatsSA (1997–2004). Note: there are two breaks in this Statistics SA series. The first lies between 1999 and 2000 with the shift over from the OHS to the LFS. The second lies between 2002 and 2003 as the 2003 and 2004 LFS is weighted to the 2001 census, while the figures for 2000–2002 are weighted to the 1996 census, based on revised population estimates. Statistics SA will release revised figures, but had not done so in time for publication.
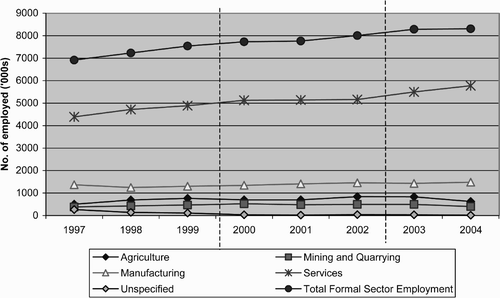
Figure 3: Non-formal employment by sector. Source: StatsSA (1997–2004). Note: non-formal employment here includes the informal sector, domestic labour, private households and unpaid family labour. Subsistence agriculture is excluded as it distorts the picture unnecessarily. It is estimated to contain between 300 000 and 400 000 participants. As in , note the breaks in the series in 2000 and in 2003.
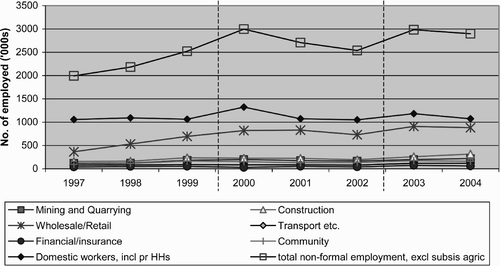
Figure 4: The distribution of employment in the South African services sector, 2003. Source: Mayer Citation (2005) , calculated from Quantec database.
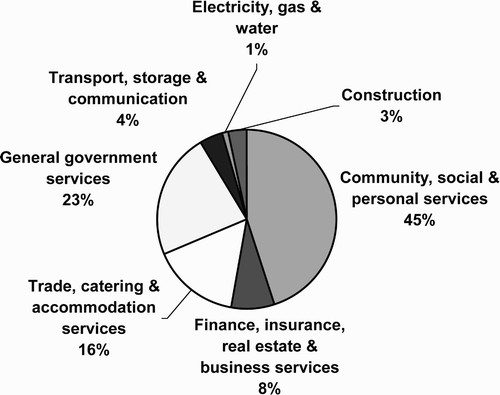
Figure 5: Output and employment growth in the services sector, 1999–2003 (percentage annual growth) Source: Mayer (2005), calculated from Quantec database.
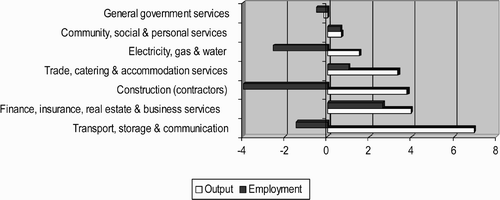
Figure 6: Tourism employment scenarios
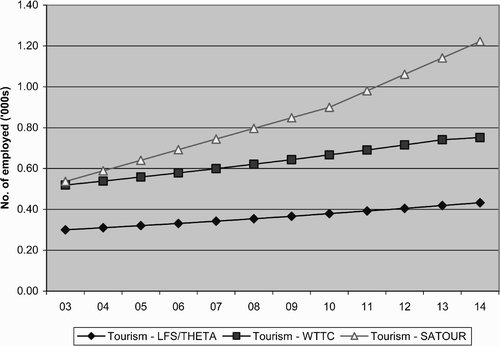
Table 1: Expenditure and estimated employment arising from government spending on infrastructure and construction
Table 2: Services employment scenarios compared
Figure 7: Sources of annual employment growth, scenario 1
Figure 8: Sources of annual employment growth, scenario 2
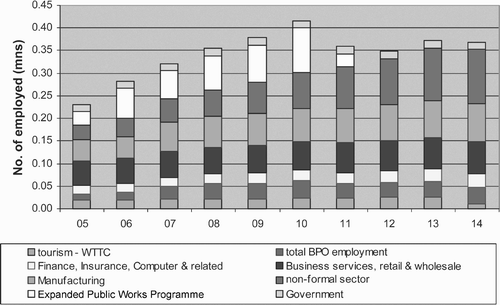
Figure 9: Employment scenarios compared