Figures & data
Figure 1: Factors and related interactions affecting smallholder cultivation of cash crops and participation in agricultural markets (Lukanu, Citation2005)
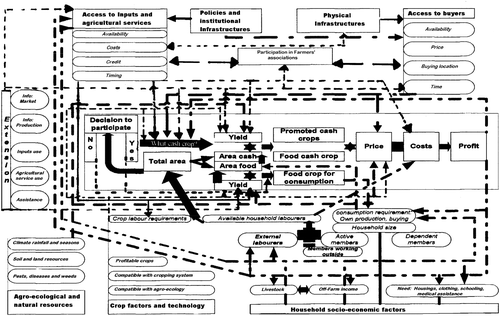
Table 1: Data used in this study and how they were assessed (ranks used: 0 = lowest rank and 5 = highest rank)
Table 2: Statistics of a regression model between available household labour (AHL) during peak period and the number of promoted cash crops cultivated (n = 287, Cuamba, September 2002)
Figure 2: Ratio of total available household labour (AHL) to labour allocated to food crops for consumption (n = 287, Cuamba, September 2002)
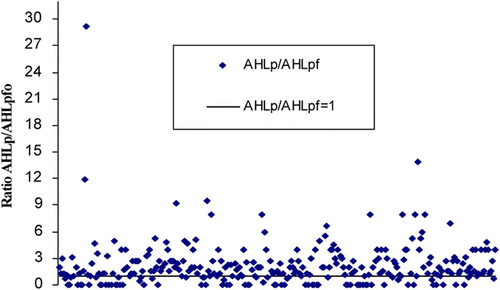
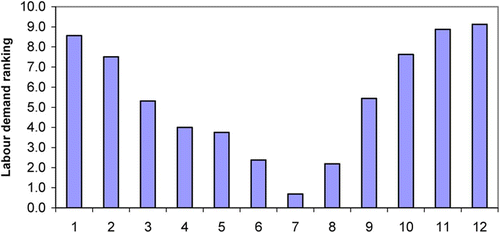
Table 3: Monthly ranking of labour demand and agricultural operations throughout the year in southern Niassa
Figure 3: Monthly ranking of labour demand and agricultural operations throughout the year in southern Niassa (based on )