Figures & data
Table 1: Households without earnings or social grants, 1997–2006
Table 2: Poverty estimates for South Africa, 1997–2006 (per capita)
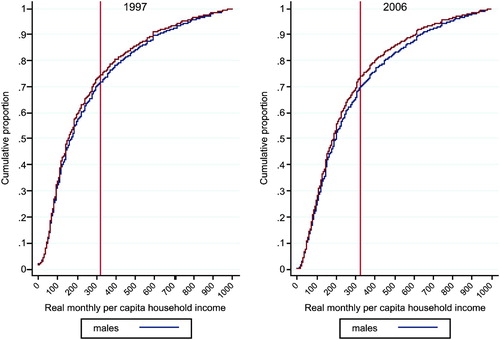
Figure 1: Cumulative distribution function of real monthly per capita household income by gender, 1997 and 2006 FootnoteNotes.