Figures & data
Figure 1: Youth and non-youth unemployment rates, 1995–2012
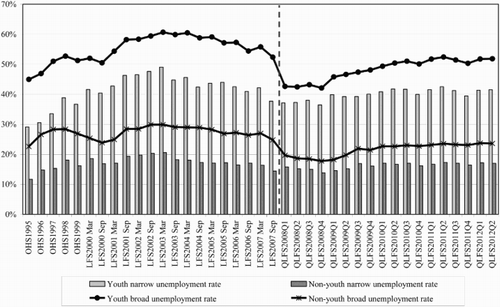
Figure 2: Youth employed, narrow unemployed and discouraged workseekers, 2008–12
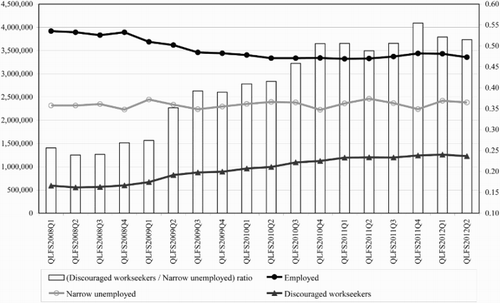
Figure 1: Youth and non-youth unemployment rates, 1995–2012
Figure 2: Youth employed, narrow unemployed and discouraged workseekers, 2008–12
Please note: Selecting permissions does not provide access to the full text of the article, please see our help page How do I view content?
To request a reprint or corporate permissions for this article, please click on the relevant link below:
Please note: Selecting permissions does not provide access to the full text of the article, please see our help page How do I view content?
Obtain permissions instantly via Rightslink by clicking on the button below:
If you are unable to obtain permissions via Rightslink, please complete and submit this Permissions form. For more information, please visit our Permissions help page.