5,171
Views
62
CrossRef citations to date
0
Altmetric
Articles

Progress through school and the determinants of school dropout in South Africa

, &

Figures & data

Table 1: Sample sizes and response rates, NIDS Waves 1 and 2

Figure 1: Schooling transitions between 2008 and 2010, males versus females
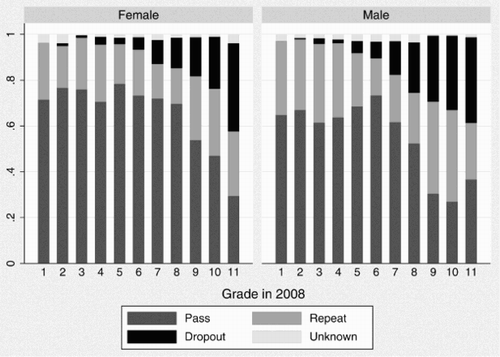
Notes: Sample restricted to respondents who were in grade 1–11 in 2008 and successfully interviewed in Wave 2. Sensitivity to the exclusion of respondents with errors identified in Table 1 were assessed and found not to be significant. Point estimates weighted using the panel weight.
Figure 1: Schooling transitions between 2008 and 2010, males versus females

Figure 2: Schooling transitions between 2008 and 2010, poorest versus richest learners
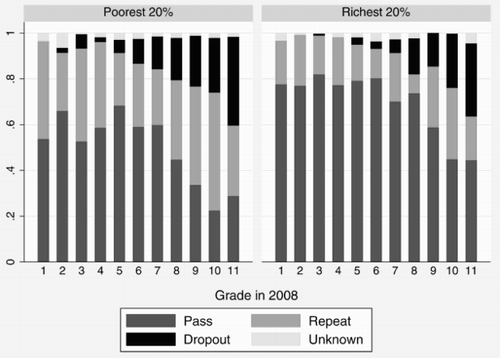
Notes: Sample restricted to respondents who were in grade 1–11 in 2008 and successfully interviewed in Wave 2. Sensitivity to the exclusion of respondents with errors identified in Table 1 were assessed and found not to be significant. Point estimates weighted using the panel weight.
Figure 2: Schooling transitions between 2008 and 2010, poorest versus richest learners

Table 2: Schooling transitions between 2008 and 2010

Figure 3: Reasons given for dropping out of school without completing matric
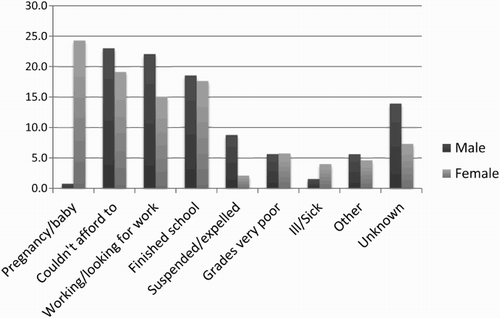
Notes: Reasons given for dropping out of school by 2010 without completing matric. Sample restricted to respondents who were in grade 1–12 in 2008. Point estimates weighted using the panel weight.
Figure 3: Reasons given for dropping out of school without completing matric

Figure 4: Transitions out of school
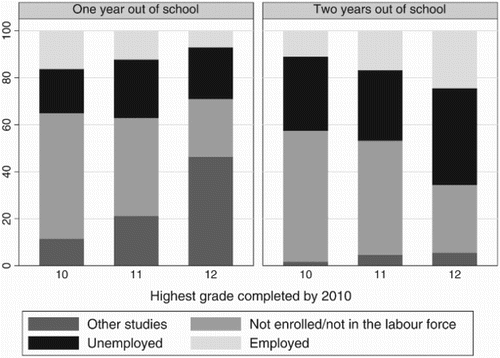
Notes: Sample restricted to respondents in grades 8–12 in 2008 who had completed grades 10–12 by 2010 and were not enrolled in grade school. This figure uses the highest-grade completed variables in wave 2. Thus some respondents would have completed some post schooling education in the two years out of school sample. Point estimates weighted using the panel weight.
Figure 4: Transitions out of school

Table 3: Comparison of mean Wave 1 characteristics by whether they dropout by Wave 2, Africans and coloureds only

Table 4: Ordinary least-squares regressions for the probability of dropping out of school by 2010 for NIDS respondents in Grades 1 to 12 in 2008

Reprints and Corporate Permissions

Please note: Selecting permissions does not provide access to the full text of the article, please see our help page How do I view content?

To request a reprint or corporate permissions for this article, please click on the relevant link below:

Academic Permissions

Please note: Selecting permissions does not provide access to the full text of the article, please see our help page How do I view content?

Obtain permissions instantly via Rightslink by clicking on the button below:

If you are unable to obtain permissions via Rightslink, please complete and submit this Permissions form. For more information, please visit our Permissions help page.