Figures & data
Table 1: Poverty shifts by race of household head, 1995–2005
Figure 1: Cumulative distribution functions, 1995 and 2005
Notes: 1. Per-capita expenditure as converted to real per-capita expenditure (expressed in 2000 prices) using the Consumer Price Index. 2. The population in 1995 has been weighted by population weights according to the 1996 Census. The population in 2005 has been weighted by the household weight multiplied by the household size. The 2005 weights are based on the 2001 Census.
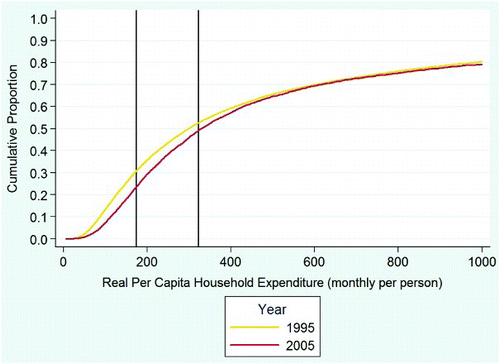
Figure 2: Cumulative distribution functions by gender of household head, 1995 and 2005
Notes: 1. Per-capita expenditure as converted to real per-capita expenditure (expressed in 2000 prices) using the Consumer Price Index. 2. The population in 1995 has been weighted by population weights according to the 1996 Census. The population in 2005 has been weighted by the household weight multiplied by the household size. The 2005 weights are based on the 2001 Census.
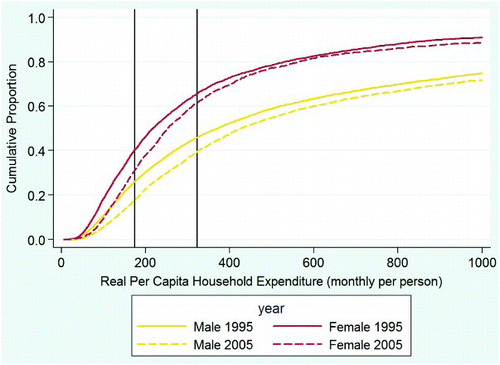
Table 2: Inequality shifts by race – Gini coefficients for 1995 and 2005
Table 3: Inequality within and between race groups, 1995 and 2005
Figure 3: Growth incidence curve for South Africa, expenditure: 1995–2005
Notes: 1. The population in 1995 has been weighted by population weights according to the 1996 Census. The population in 2005 has been weighted by the household weight multiplied by the household size. The 2005 weights are based on the 2001 Census. 2. Figures are annualised growth rates.
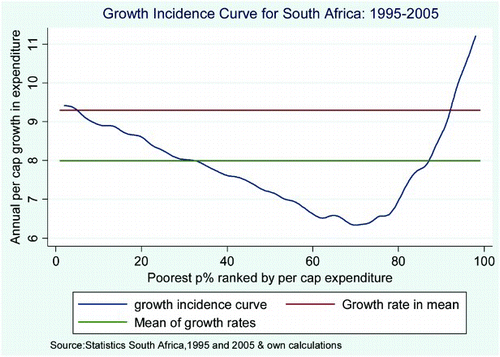
Figure 4: Household access to social grants per household income decile, 1995–2005
Notes: 1. The population in 1995 has been weighted by population weights according to the 1996 Census. The population in 2005 has been weighted by the household weight multiplied by the household size. The 2005 weights are based on the 2001 Census.
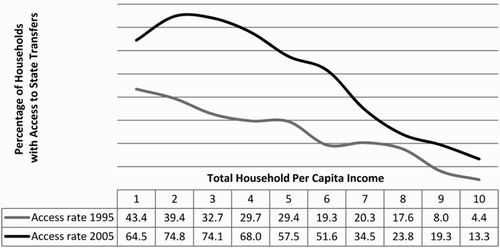
Figure 5: Per-capita grant income as proportion of total household income, South Africa, 1995 and 2005
Notes: 1. The population in 1995 has been weighted by population weights according to the 1996 Census. The population in 2005 has been weighted by the household (HH) weight multiplied by the household size. The 2005 weights are based on the 2001 Census.
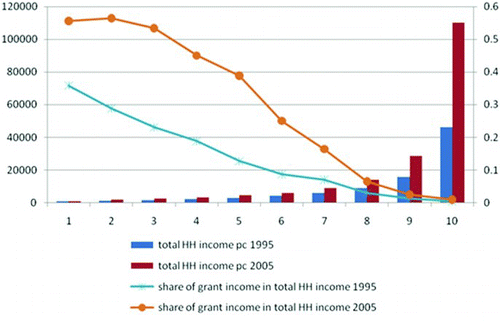
Table 4: Gini coefficient for total per-capita income with and without grant income by race, 1995 and 2005
Figure 6: Lorenz curves for Africans: with and without grant income, 1995 and 2005
Notes: 1. The population in 1995 has been weighted by population weights according to the 1996 Census. The population in 2005 has been weighted by the household (HH) weight multiplied by the household size. The 2005 weights are based on the 2001 Census.
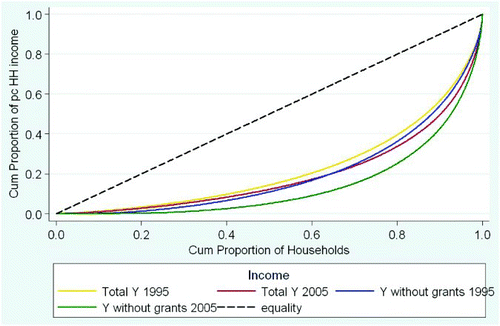
Table 5: Gini coefficient including and excluding grant income from total income by province and gender of household head, 1995–2005
Figure 7: Growth incidence curve for total income (including grant income), 1995–2005
Notes: 1. The population in 1995 has been weighted by population weights according to the 1996 Census. The population in 2005 has been weighted by the household weight multiplied by the household size. The 2005 weights are based on the 2001 Census. 2. Figures are annualised growth rates.
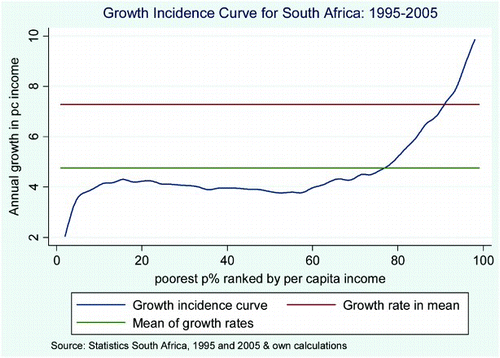
Figure 8: Growth incidence curve for total income (excluding grant income), 1995–2005
Notes: 1. The population in 1995 has been weighted by population weights according to the 1996 Census. The population in 2005 has been weighted by the household weight multiplied by the household size. The 2005 weights are based on the 2001 Census. 2. Figures are annualised growth rates.
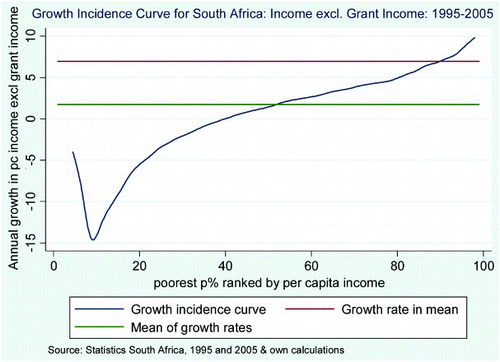
Figure 9: Growth incidence curve for rural households: income including grant income, 1995–2005
Notes: 1. The population in 1995 has been weighted by population weights according to the 1996 Census. The population in 2005 has been weighted by the household (HH) weight multiplied by the household size. The 2005 weights are based on the 2001 Census. 2. Figures are annualised growth rates.
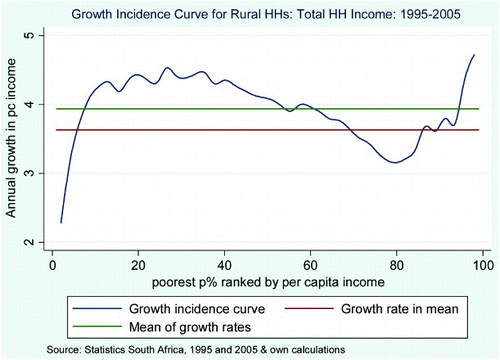
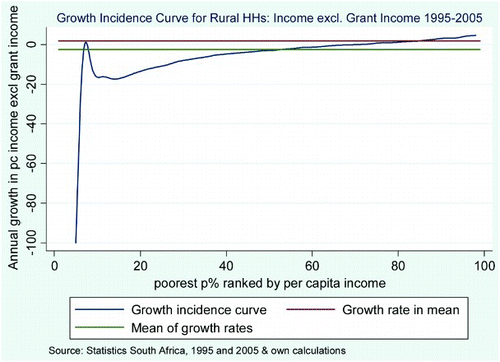
Figure 10: Growth incidence curve for rural households: income excluding grant income: 1995–2005
Notes: 1. The population in 1995 has been weighted by population weights according to the 1996 Census. The population in 2005 has been weighted by the household (HH) weight multiplied by the household size. The 2005 weights are based on the 2001 Census. 2. Figures are annualised growth rates.
