Figures & data
Figure 1: Prevalence of stunting by gross national income per head (purchasing power parity estimates, US$), 2007–10
Note: GNI, Gross National Income; PPP, purchasing power parity.
Sources: UNICEF (Citation2009), World Bank (Citation2010).
Sources: UNICEF (Citation2009), World Bank (Citation2010).
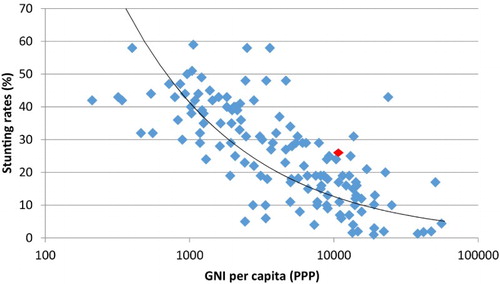
Table 1: Characteristics of children aged six to 59 months whose anthropometric measurements were and were not taken, 1993 and 2008 surveys
Figure 2: Prevalence of money-metric poverty, 2008
Table 2: Prevalence of stunting, wasting, underweight, the composite index of failure and poverty among children aged six to 59 months (%)
Figure 3: Kernel density estimates of the distribution of the anthropometric z-scores of children aged six to 59 months, 1993 and 2008
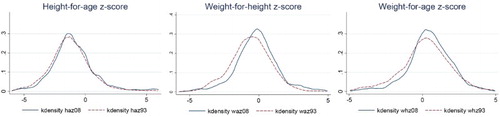
Figure 4: Prevalence of anthropometric deficits among children aged six to 59 months, 2008
Figure 5: Anthropometric z-scores of children aged six to 59 months by decile based on their household's per-capita expenditure, 1993 and 2008
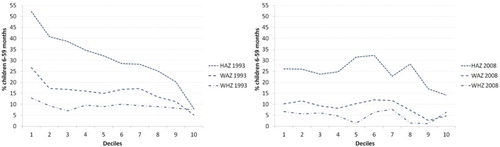
Figure 6: Cumulative proportion of stunted children aged six to 59 months by decile based on their household's per-capita expenditure, 1993 and 2008