
Figures & data
Figure 1: Two hypothetical concentration curves of actual inpatient healthcare utilisation
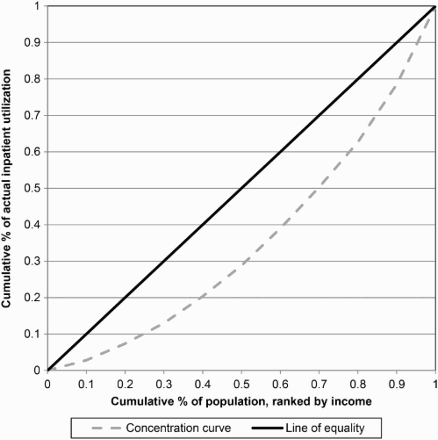
Table 1: Descriptive statistics – distribution of variables
Figure 2: Concentration curves of inpatient healthcare utilisation, ranked from poorest to richest by consumption
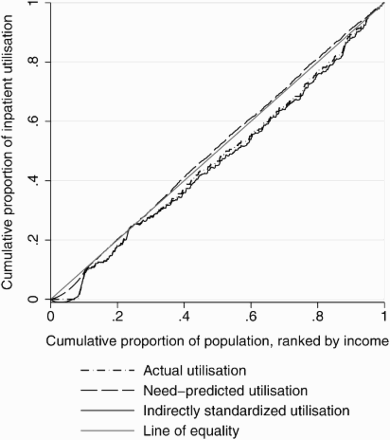
Table 2: Inequalities in inpatient healthcare utilisation
Table 3: Decomposition of concentration index of inpatient healthcare utilisation
Table S1: List of languages that are included within black and non-black populations
Supplemental material