Figures & data
Figure 1: Percent share of tourism in GDP, 1988–2014.
Source: Bank of Mauritius Annual Reports (www.bom.mu).
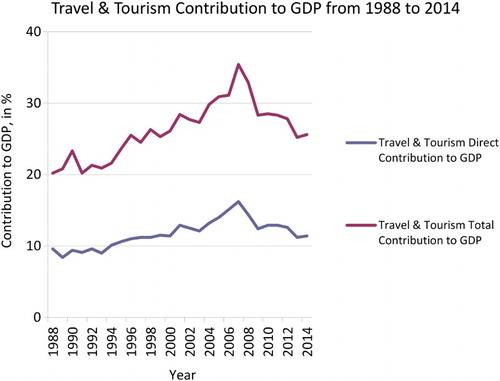
Figure 2: Tourist arrivals, 1974–2012.
Source: Central Statistics Office (www.statsmauritius.gov.mu).
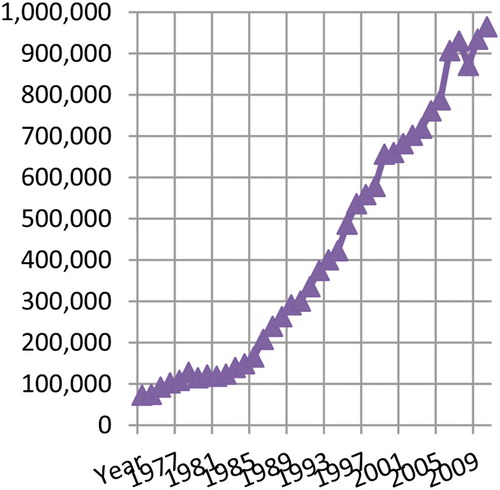
Figure 3: Tourism receipts, 1974–2012.
Source: Central Statistics Office (www.statsmauritius.gov.mu).
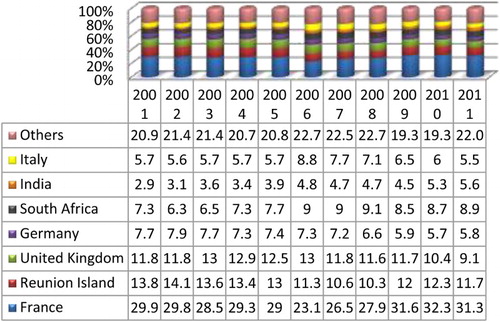
Figure 4: Percent distribution of tourist arrivals by country of residence, 2001–12.