Figures & data
Figure 1: Links between maternal and child health, nutrition and welfare
Source: Commission on the Nutrition Challenges of the 21st Century (Citation2000).
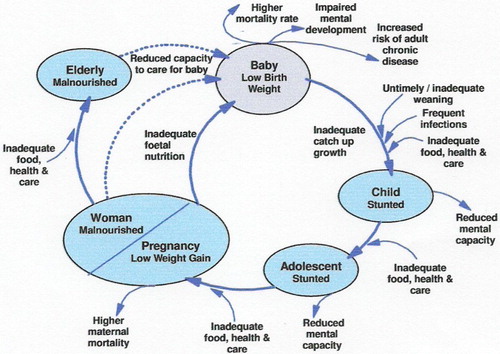
Figure 2: Average life expectancy and HIV prevalence, Zimbabwe, 1990–2011
Source: World Bank (Citation2014).
Note: For average life expectancy, the scale on the y axis is in years; for HIV prevalence, the y-axis scale is in per cent.
Note: For average life expectancy, the scale on the y axis is in years; for HIV prevalence, the y-axis scale is in per cent.
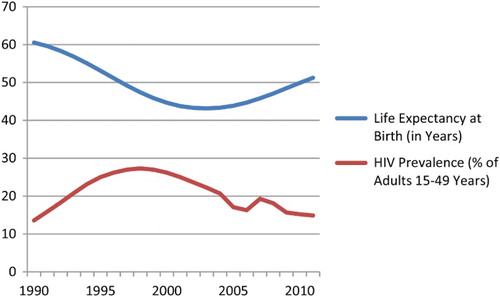
Figure 3: Infant and under-five mortality rates, Zimbabwe, 1984–2011
Source: CSO & Institute for Resource Development/Macro Systems (Citation1989); CSO & Macro International (Citation1995, Citation2000, Citation2007); ZIMSTAT & UNICEF (Citation2010); ZIMSTAT & Measure DHS, IFC Macro (Citation2012).
Note: Each survey measures the IMR and U5MR for the four years prior to that survey; for example, the ZDHS1988 measures the IMR and U5MR for the period 1984–88. ZDHS, Zimbabwe Demographic and Health Survey; MIMS, Multiple Indicator Monitoring Survey.
Note: Each survey measures the IMR and U5MR for the four years prior to that survey; for example, the ZDHS1988 measures the IMR and U5MR for the period 1984–88. ZDHS, Zimbabwe Demographic and Health Survey; MIMS, Multiple Indicator Monitoring Survey.
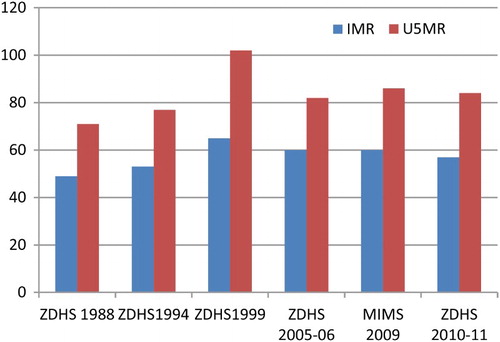
Figure 4: Maternal mortality rate, Zimbabwe, 1994–2011
Source: CSO & Macro International (Citation1995, Citation2000, Citation2007); ZIMSTAT & Measure DHS, IFC Macro (Citation2012). ZDHS, Zimbabwe Demographic and Health Survey.
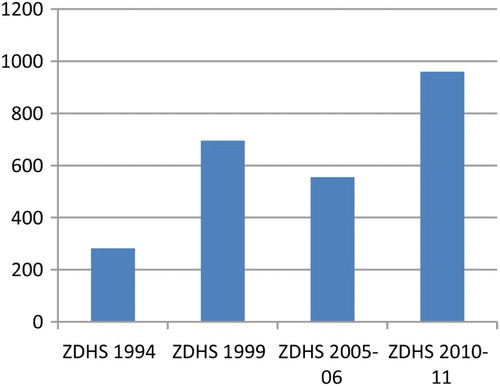
Figure 5: Stunting and wasting among children 12–59 months, Zimbabwe, 1988–2011
Source: CSO & Institute for Resource Development/Macro Systems (Citation1989); CSO & Macro International (Citation2000, Citation2007); ZIMSTAT& UNICEF (Citation2010); ZIMSTAT & Measure DHS, IFC Macro (Citation2012).Note: SD = standard deviation.
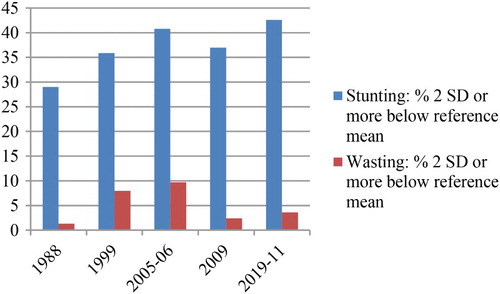
Figure 6: Immunisation rates for children 12–59 months, 1988–2011
Source: CSO & Institute for Resource Development/Macro Systems (Citation1989); CSO & Macro International (Citation1995, Citation2000, Citation2007); ZIMSTAT & UNICEF (Citation2010); ZIMSTAT & Measure DHS, IFC Macro (Citation2012).
Note: In 1988, no ZDHS data were published on the percentage of children with no immunisation. ZDHS – Zimbabwe Demographic and Health Survey.
Note: In 1988, no ZDHS data were published on the percentage of children with no immunisation. ZDHS – Zimbabwe Demographic and Health Survey.
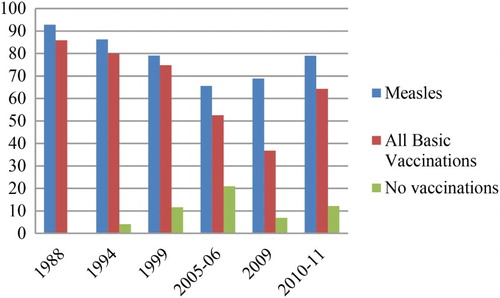
Figure 7: Number of children orphaned by HIV/AIDS, Zimbabwe, 1990–2010
Source: World Bank (Citation2014).
Note: An orphan is a child zero to 17 years of age who has lost one or both parents due to HIV/AIDS.
Note: An orphan is a child zero to 17 years of age who has lost one or both parents due to HIV/AIDS.
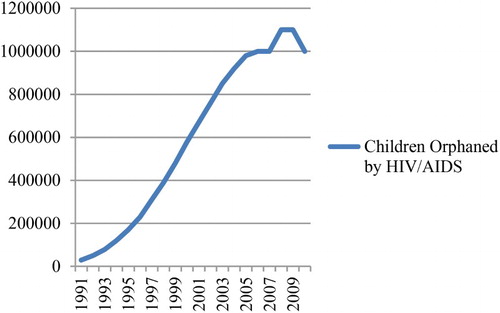
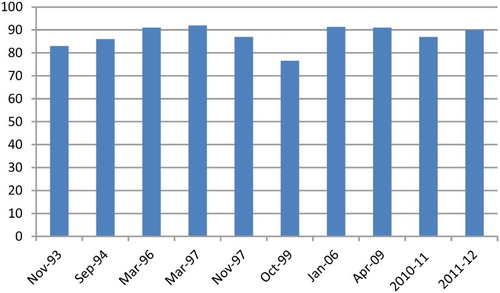
Figure 8: Net primary school enrolment, Zimbabwe, 1993–2012
Source: Inter-Ministerial Committee on SDA Monitoring (Citation1994, Citation1995, Citation1996, Citation1997, Citation1999); CSO & Macro International (Citation2000, Citation2007); ZIMSTAT & Measure DHS, IFC Macro (Citation2012); ZIMSTAT & UNICEF (Citation2010); ZIMSTAT (Citation2013).
Note: Net primary enrolment rates in Zimbabwe tend to be 5 to 10% higher at the beginning of the school year than at the end since some pupils drop out during the school year, which starts in January. Where the survey fieldwork lasted several months, the mid-point was taken. The estimate for October 1999 is probably an underestimate; the government estimated net enrolment of 86.8% (MESC, Citation2000). The figure for 2010/11 is the net attendance rate; attendance is always marginally lower than enrolment.
Note: Net primary enrolment rates in Zimbabwe tend to be 5 to 10% higher at the beginning of the school year than at the end since some pupils drop out during the school year, which starts in January. Where the survey fieldwork lasted several months, the mid-point was taken. The estimate for October 1999 is probably an underestimate; the government estimated net enrolment of 86.8% (MESC, Citation2000). The figure for 2010/11 is the net attendance rate; attendance is always marginally lower than enrolment.