Figures & data
Figure 1: Kernel density distributions of TIMSS mathematics scores and matric mathematics scores by former department and by race
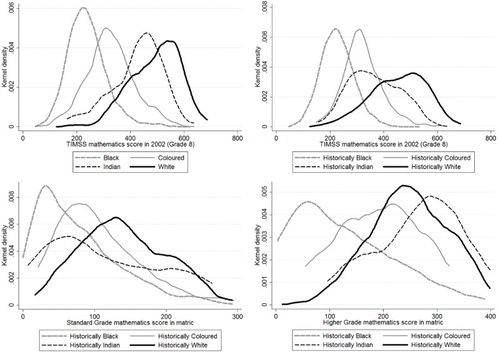
Table 1: Descriptive statistics of key outcomes by race, former department and year of reaching matric
Table 2: Grade repetition rates by race group according to GHS 2011
Figure 2: Age-specific enrolment rates
Table 3: Mean TIMSS mathematics scores by ex-department and matric cohort
Figure 3: Predicted probabilities of passing matric by former department (based on )
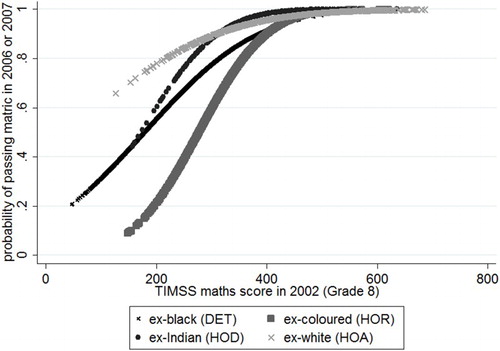
Table 4: Probit regression predicting passing matric
Table 5: Participation in matric mathematics by former department
Figure 4: Predicted probability of taking mathematics in matric by former department (based on )
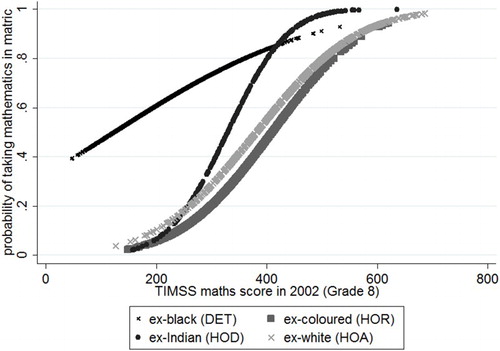
Table 6: Probit regression predicting participation in matric mathematics
Figure 5: Lowess regression of matric standard grade mathematics scores against TIMSS mathematics scores
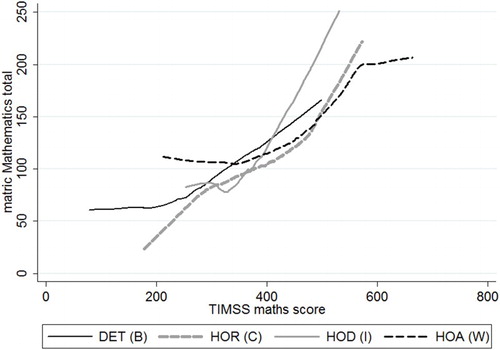
Figure 6: Kernel density distributions of TIMSS mathematics scores by former department only amongst those taking standard grade matric mathematics
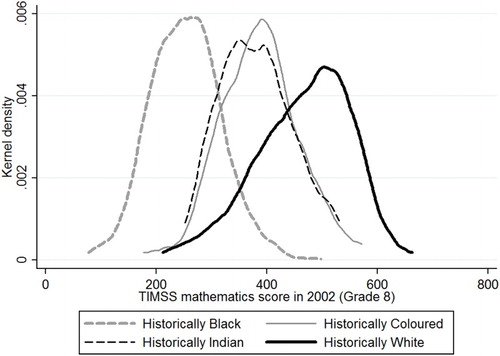
Figure 7: Proportion of Grade 8 students going on to achieve at least 50% in matric mathematics