Figures & data
Table 1: Population size (in millions)
Table 2: Male by age group (%)
Table 3: Female by age group (%)
Table 4: Number of households
Table 5: Comparison of demographics across the panel samples (%)
Table 6: Median household consumption, income and grants
Figure 1: Mean household size
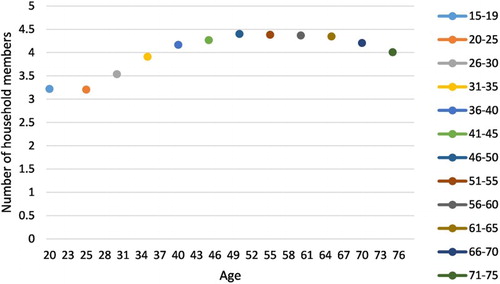
Table 7: Cross-section of age, cohorts and birth years
Figure 2: Household income
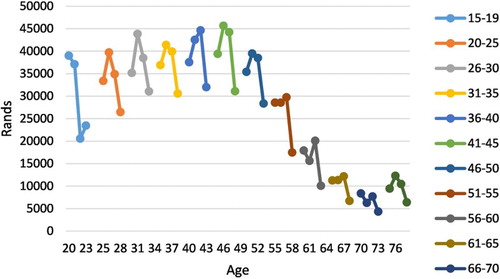
Figure 3: Total household income (includes social grant receipts)
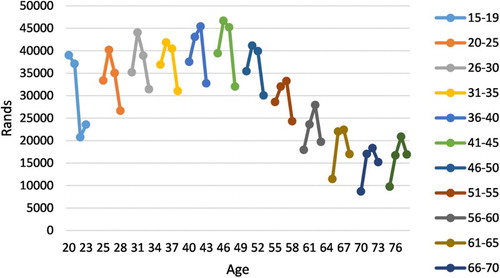
Figure 4: Mean household consumption
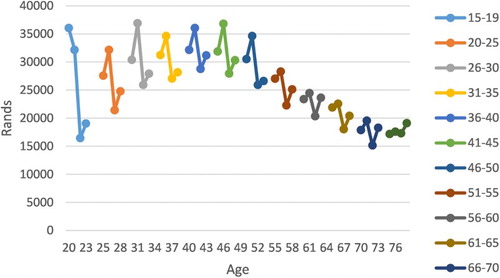
Figure 5: Marginal propensity to save Note: MPS = marginal propensity to save.
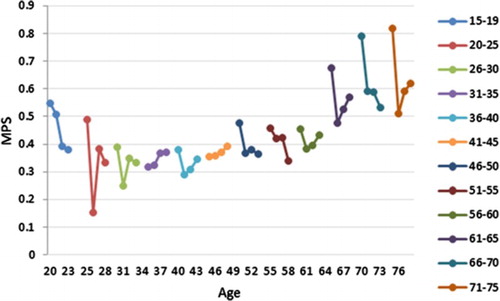
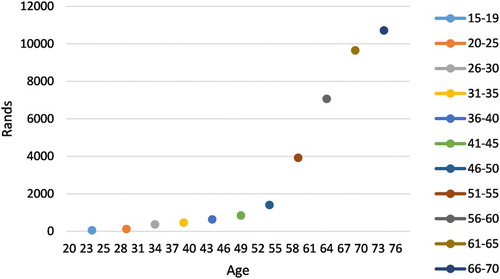
Figure 6: Mean household grants