1,042
Views
2
CrossRef citations to date
0
Altmetric
ARTICLES

Twenty-year review of South African fiscal policy: A tale of two sustainabilities

&

Figures & data

Figure 1: Public debt (national government) (% of GDP)
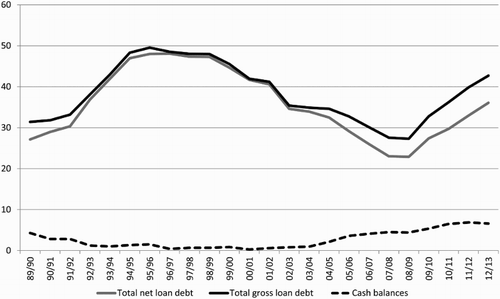
Source: SARB Quarterly bulletin – National Revenue Fund data.
Figure 1: Public debt (national government) (% of GDP)

Figure 2: Conventional (overall), current and primary balances (national government, based on national government finance data) (% of GDP)
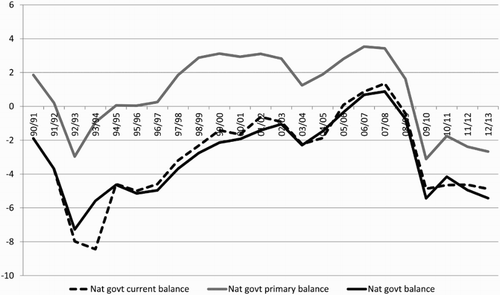
Source: SARB Quarterly bulletin – national government finance data.
Figure 2: Conventional (overall), current and primary balances (national government, based on national government finance data) (% of GDP)

Figure 3: Structural budget balance of general government in selected peer countries (% of potential GDP)
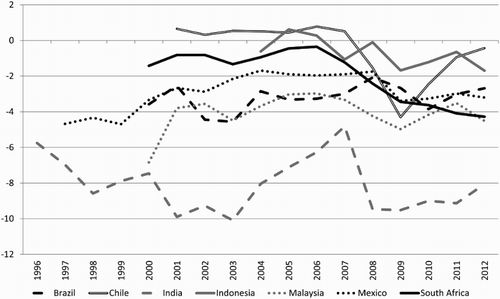
Source: Quantec/IMF World Economic Outlook (Citation2014).
Figure 3: Structural budget balance of general government in selected peer countries (% of potential GDP)

Figure 4: National and general government total expenditure and revenue adjusted for cash flows (fiscal years) (% of GDP)
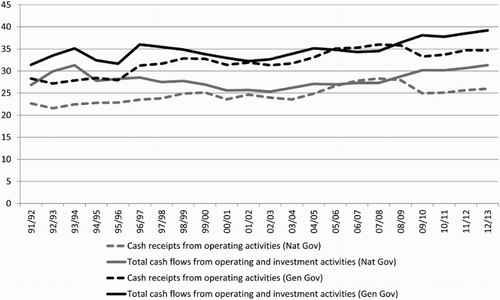
Source: SARB Quarterly bulletin – Government Finance Statistics data.
Figure 4: National and general government total expenditure and revenue adjusted for cash flows (fiscal years) (% of GDP)

Table 1: Summary values for receipts, operating payments and investment activity (% of GDP)

Figure 5: General government expenditure in selected peer countries (% of GDP)
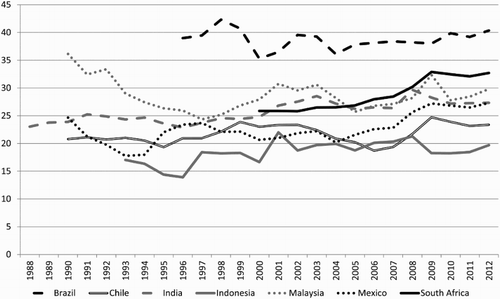
Source: Quantec/IMF World Economic Outlook (Citation2014).
Figure 5: General government expenditure in selected peer countries (% of GDP)

Figure 6: General government revenue in selected peer countries (% of GDP)
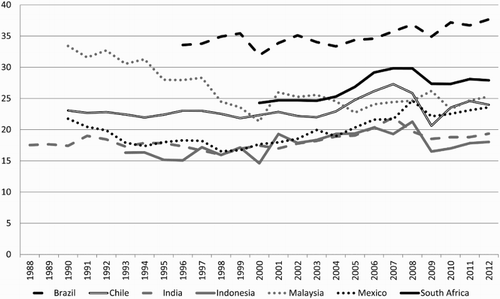
Source: Quantec/IMF World Economic Outlook (Citation2014).
Figure 6: General government revenue in selected peer countries (% of GDP)

Table 2: Gini coefficients of per-capita income, aggregate and by race

Figure 7: South Africans living below the poverty line
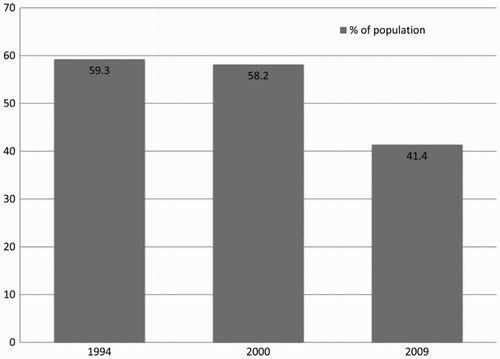
Note: The poverty line has been set at R3864 per capita in 2000 prices. This is the official poverty line proposed by Murray Leibbrandt and Ingrid WoolardSource: Transformation Audit Blog (Citation2012).
Figure 7: South Africans living below the poverty line

Figure 8: Functional classification of cash payments for operating activities and purchases of non-financial assets of consolidated general government (fiscal years), expressed as a ratio of total of such expenditure
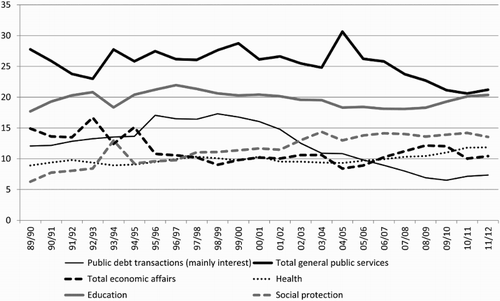
Note: Total general public services includes public debt transactions (mainly interest)Source: StatsSA Citation2014.
Figure 8: Functional classification of cash payments for operating activities and purchases of non-financial assets of consolidated general government (fiscal years), expressed as a ratio of total of such expenditure

Table 3: Number of grant recipients (thousands)

Table 4: Monthly social grant amounts (rand)

Figure 9: Domestic (rand-denominated) bonds (excluding treasury bills) held by foreigners
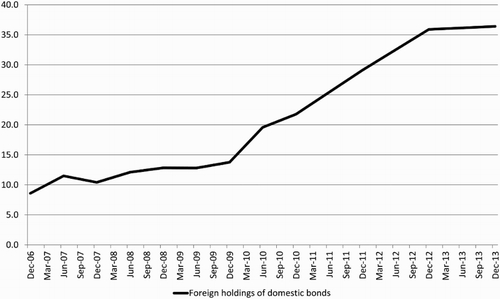
Source: National Treasury (Citation2014a).
Figure 9: Domestic (rand-denominated) bonds (excluding treasury bills) held by foreigners

Reprints and Corporate Permissions

Please note: Selecting permissions does not provide access to the full text of the article, please see our help page How do I view content?

To request a reprint or corporate permissions for this article, please click on the relevant link below:

Academic Permissions

Please note: Selecting permissions does not provide access to the full text of the article, please see our help page How do I view content?

Obtain permissions instantly via Rightslink by clicking on the button below:

If you are unable to obtain permissions via Rightslink, please complete and submit this Permissions form. For more information, please visit our Permissions help page.