Figures & data
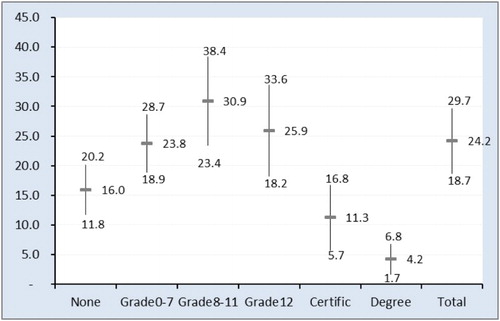
Figure 1. Long-run unemployment rate by education: 1995–2012.
Source: PALMS, DataFirst; authors’ own calculations. Note: The 95% confidence interval is constructed by calculating the mean unemployment rate and standard deviations, and then applying the empirical rule which states that nearly all values lie within three standard deviations of the mean in a normal distribution.