Figures & data
Table 1. Dominant enterprises on land reform projects (n = 37).
Table 2. Land reform projects according to type of land reform sub-programme and location (n = 37).
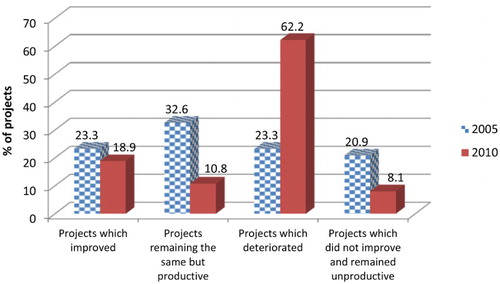
Figure 1. Production status of land reform projects: 2005 and 2010 (% of surveyed farms). Source: Authors’ own calculations.
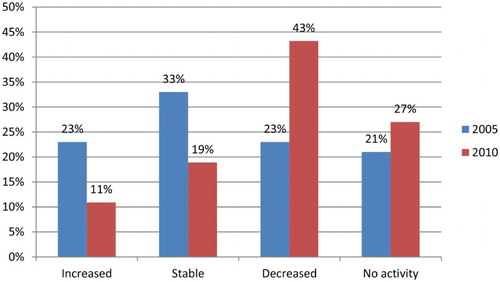
Table 3. Details of projects showing increased production (Category 1) in 2010.
Table 4. Details of projects reporting a decrease in production (Category 3) since 2005.
Table 5. Summary statistics on farm size for the projects in 2010 (n = 37).
Figure 2. Performance trends in land reform projects in North West province between 2005 and 2010.