Figures & data
Figure 1. Number of employed and unemployed, 1995–2015. Note: OHS = October Household Survey; LFS = Labour Force Survey; QLFS = Quarterly Labour Force Survey.Source: Authors’ own calculations using OHS 1995–99, LFS 2000–07 and QLFS 2008Q1–2015Q3 data.
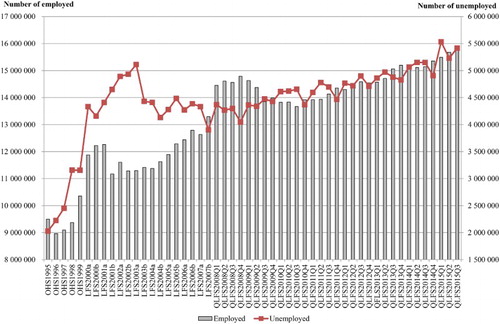
Figure 2. Unemployment rates, 1995–2015. Note: OHS = October Household Survey; LFS = Labour Force Survey; QLFS = Quarterly Labour Force Survey.Source: Authors’ own calculations using OHS 1995–99, LFS 2000–07 and QLFS 2008Q1–2015Q3 data.
Table 1. Labour force under the narrow definition: OHS 1995, LFS 2005 and QLFS 2015.
Table 2. Employment: OHS 1995, LFS 2005 and QLFS 2015.
Figure 3. Annual percentage growth of employment versus annual percentage growth of real gross value added (2010 prices) by industry, 1995–2015. Note: OHS = October Household Survey; LFS = Labour Force Survey; QLFS = Quarterly Labour Force Survey.Source: Authors’ own calculations using OHS 1995, QLFS 2015Q3 and South African Reserve Bank Quarterly Bulletin data.
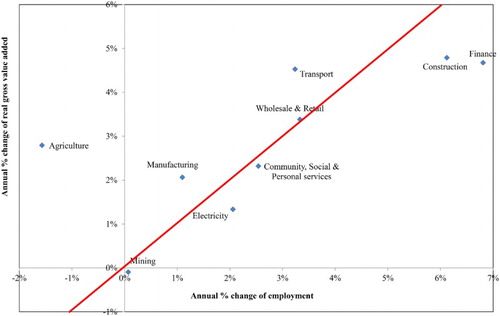
Table 3. Employment elasticity to economic growth.
Table 4. Heckprobit regression on employment likelihood, conditional on labour force participation.
Table 5. Unemployment under the narrow definition.
Figure 4. Previous work experience of the unemployed, QLFS 2015Q3. Note: OHS = October Household Survey; LFS = Labour Force Survey; QLFS = Quarterly Labour Force Survey.Source: Authors’ own calculations using QLFS 2015Q3 data.
Figure 5. Total number of workers at the firms where the employees worked, selected surveys. Note: The question on firm size has only been asked since LFS 2000 September. OHS = October Household Survey; LFS = Labour Force Survey; QLFS = Quarterly Labour Force Survey.Source: Authors’ own calculations using LFS 2000, 2003 and 2006 September as well as QLFS 2009, 2012 and 2015 Q3 data.
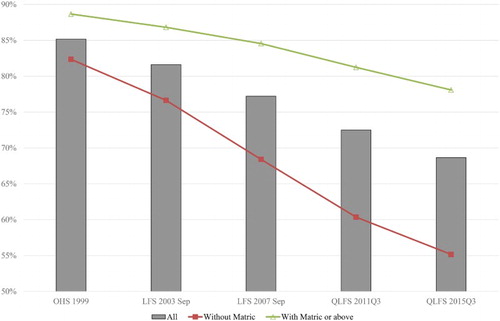
Figure 6. Proportion of formal-sector employees employed permanently, selected surveys. Note: The question on type of employment contract has only been asked since OHS 1999. OHS = October Household Survey; LFS = Labour Force Survey; QLFS = Quarterly Labour Force Survey.Source: Authors’ own calculations using OHS 1999, LFS 2003 and 2007 September, and QLFS 2011 and 2015 Q3 data.