Figures & data
Table 1. Number of patient interviews, by survey round.
Table 2. Reasons for loss to follow-up.
Table 3. Socio-demographic characteristics of baseline respondents and replacements.
Table 4. Attrition analysis.
Table 5 Subjective health status and clinical outcomes, by treatment duration.
Table 6. Labour force status, by treatment duration.
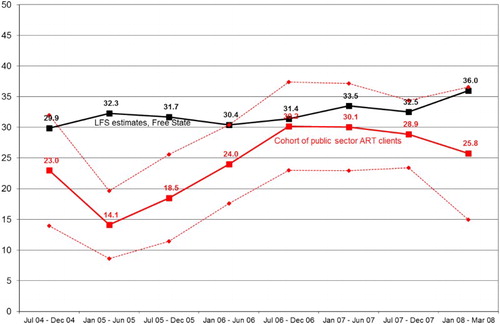
Figure 1. Trends in illness/disability among the workforce (%).
Note: Outcomes for ART patients represent results for a balanced panel only (i.e. patients observed in all six survey rounds). Provincial estimates of the numbers of ill/disabled persons in the workforce are not available for all Labour Force Survey (LFS) years. Estimates are for unadjusted LFS data series (Statistics South Africa, Citation2007–Citation08). LFS estimates are weighted in accordance with the race and sex composition of the CP6 cohort.
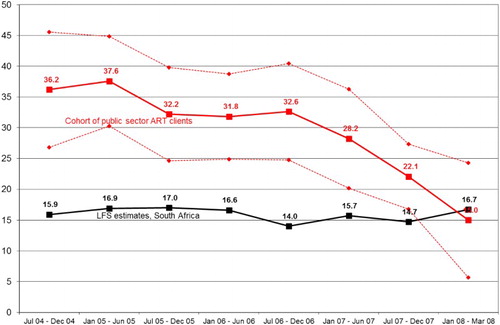
Figure 2. Trends in labour force participation rates (%).
Note: Outcomes for ART patients represent results for a balanced panel only (i.e. patients observed in all six survey rounds). Estimates are for adjusted Labour Force Survey (LFS) data series (Statistics South Africa, Citation2007–Citation08). LFS estimates are weighted in accordance with the race and sex composition of the CP6 cohort.
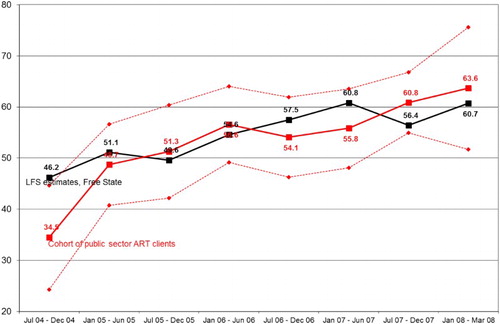
Figure 3. Trends in unemployment rates (%).
Note: Outcomes for ART patients represent results for a balanced panel only (i.e. patients observed in all six survey rounds). Estimates are for adjusted Labour Force Survey (LFS) data series (Statistics South Africa, Citation2007–Citation08). LFS estimates are weighted in accordance with the race and sex composition of the CP6 cohort.
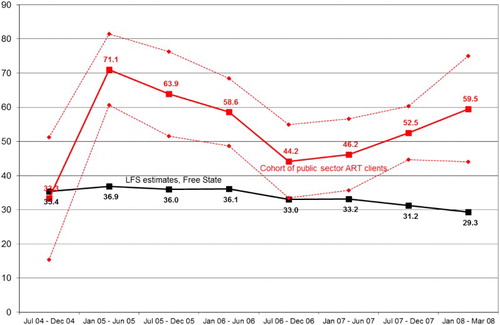
Figure 4. Trends in labour force absorption rates (%).
Note: Outcomes for ART patients represent results for a balanced panel only (i.e. patients observed in all six survey rounds). Estimates are for adjusted Labour Force Survey (LFS) data series (Statistics South Africa, Citation2007–Citation08). LFS estimates are weighted in accordance with the race and sex composition of the CP6 cohort.