Figures & data
Table 1: Productivity per worker (in 2005 US$) 1975–2012
Table 2: Sectoral composition of GDP in Zambia (%), 1965–2013
Table 3: Average value-added composition by sector (%), 1965–2013.
Table 4: Employment trends by type, 1970–2012
Table 5: Employment composition by sector (%), 1975–2012
Table 6: Poverty headcount dynamics using different poverty lines (%), 2006 and 2010
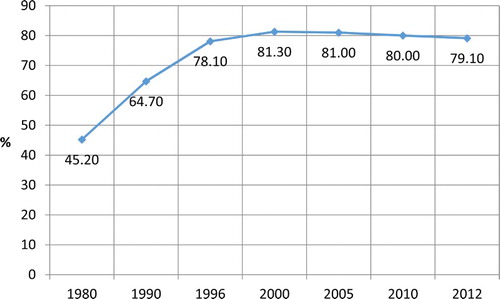
Figure 1: Share of vulnerable employment in total employment in Zambia, 1980–2012 (%). .
Source: Author based on data from Word Development Indicators 2014 (DataBank Online)