Figures & data
Figure 1. View of economy as part of a larger system. Source: Costanza et al. (Citation2009).
Table 1. Indicators and measures.
Figure 2. Barometer visual. Source: Author.
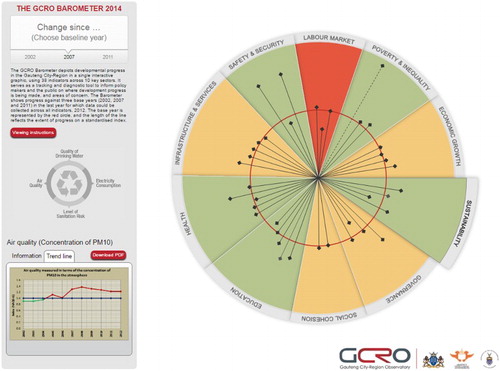
Table 2. Key for interpreting the average indexes.
Figure 3. Map of Gauteng province. Source: GCRO Maps/GIS.
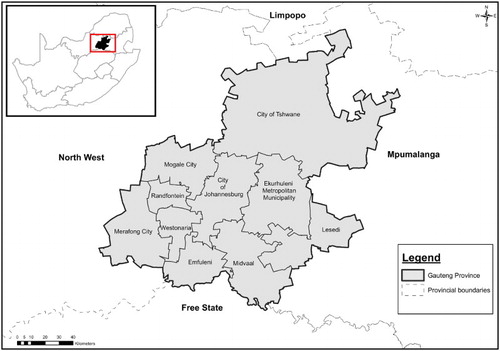
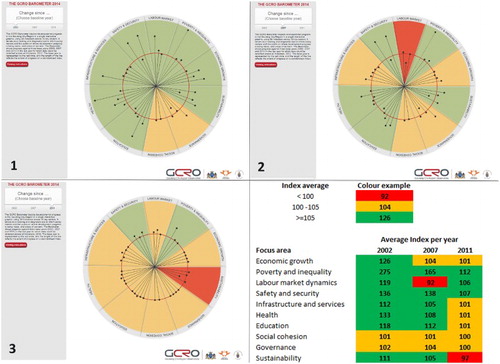
Figure 4. Changes over time. Slide 1: Change since 2002; Slide 2: Change since 2007; Slide 3: Change since 2011; Slide 4: Average Index per year. Source: Author.