Figures & data
Figure 1. Cohort follow-up.
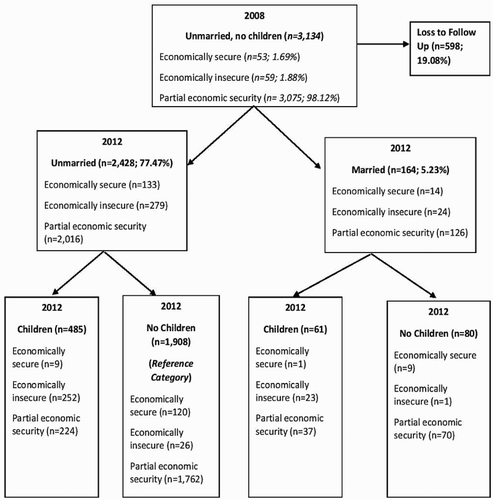
Table 1. Percentage distribution of demographic characteristics among youth, Wave 1 (2008).
Table 2. Percentage changes in economic security over time, Wave 1 (2008) and Wave 3 (2012).
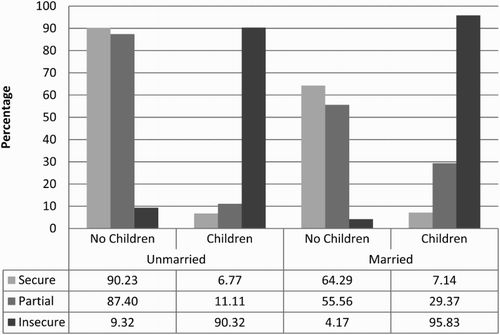
Figure 2. Description of the study sample at Wave 3 by family status and economic security status.