Figures & data
Figure 1. Documented immigrants and self-declared emigrants, 1950–2003. Source: own representation, data from StatsSA (Citation2003).
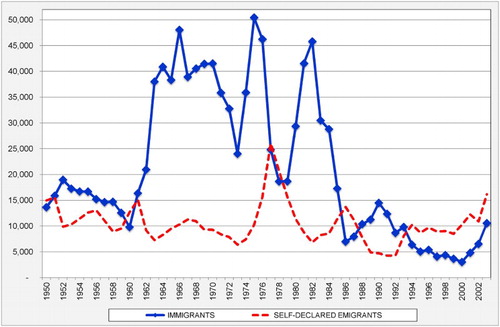
Figure 2. Development of South African born population in the traditional five emigrant destinations, 2000–13. Source: own representation, data from Australian Bureau of Statistics, Statistics Canada, Statistics New Zealand, Office for National Statistics (UK) and U.S. Census Bureau.
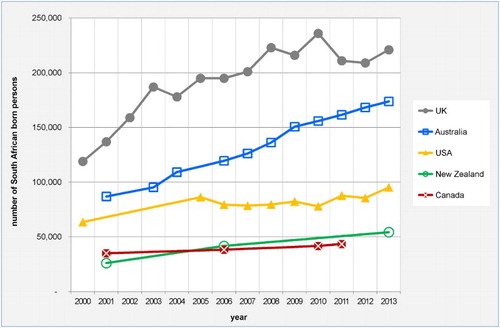
Figure 3. Development of total South African born population in the traditional five emigrant destinations, 2000–13. Source: see .
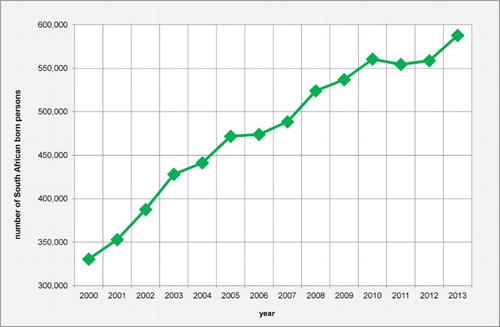
Figure 4. Estimated South African born population in the United Arab Emirates, 2000–13. Source: own estimates using data from United Nations (Citation2013) and Phampi (Citation2013).
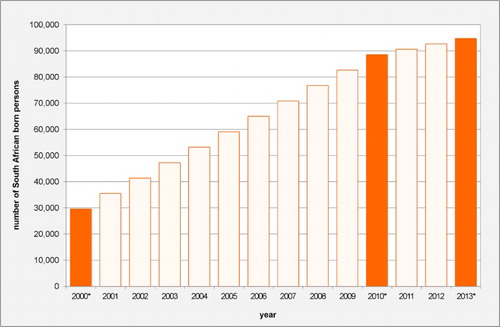
Figure 5. Stock of South African born population in other OECD countries, 2000–12. Source: OECD (Citation2015); CBS (Citation2008); Koehler (Citation2008).
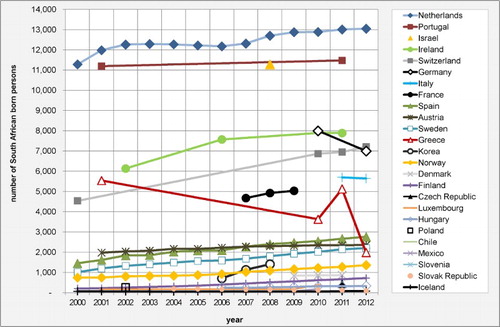
Figure 6. Development of total stock of South African born persons overseas, 2000–13. Source: see .
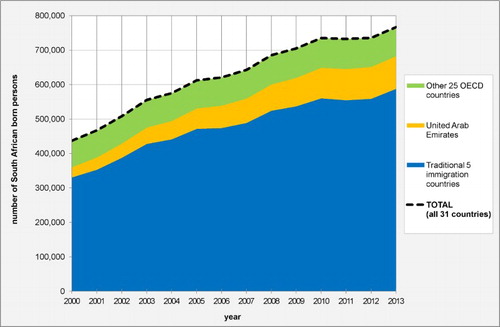
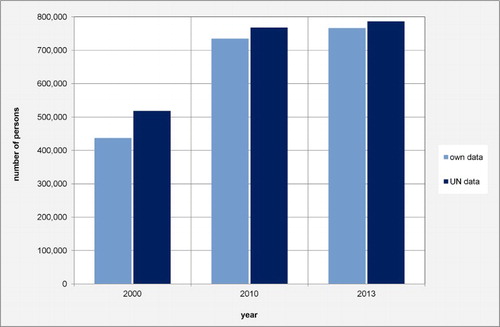
Figure 7. Stock of South African born migrants – United Nations data vs. own data. Source: see ; United Nations (Citation2013).