Figures & data
Table 1. Overview of assets, data and survey procedure.
Figure 1. Location of Freedom Square. Sources: Marais and Ntema (Citation2013).
Table 2. Perceived wealth ranking in Freedom Square at time of first settling in Freedom Square, in 2008 and in 2014.
Table 3. Changes in perceived wealth ranking in Freedom Square.
Table 4. Household assets at time of first settling in Freedom Square, in 2008 and in 2014.
Table 5. Changes in total number of household assets in Freedom Square.
Table 6. Households’ access to financial assets at time of first settling in Freedom Square, in 2008 and in 2014.
Figure 2. Increase in average house size in Freedom Square, 1990–2014. Sources: Botes et al. (Citation1991), Marais and Ntema (Citation2013), Marais et al. (Citation2014) panel survey.
Note: Y axis: Number of rooms.
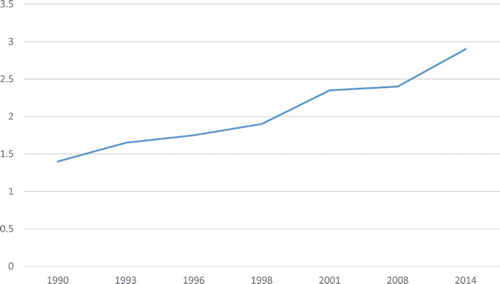
Figure 3. Average annual income per respondent in Freedom Square, 1990, 1993, 2008 and 2014.
Note: Amounts are all in 2014 ZAR values. Average exchange rate for 2014 was 10.84 ZAR to 1 USD.
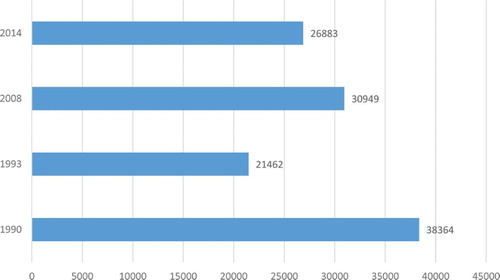
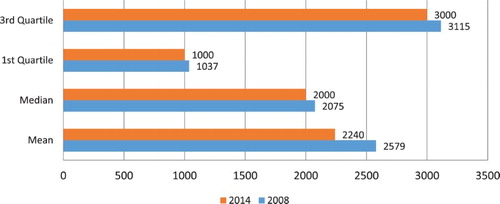
Figure 4. Cut-off amounts for quartiles, medians and means in Freedom Square, 2008 and 2014.
Note: We used the average monthly salary for households. Amounts are all in 2014 ZAR values. Average exchange rate for 2014 was 10.84 ZAR to 1 USD.