Figures & data
Table 1. Demographics in eight urban township field investigation sites across South Africa.
Table 2. Household annual income data: number of households (2011 nominal values).
Table 3. Micro-enterprises located by category in small-area census research of eight urban residential townships.
Table 4. Food-related micro-enterprises within the township research sites.
Table 5. Number of food-related enterprises per 1000 people in the research sites.
Table 6. Extrapolated food-related micro-enterprise numbers across South African urban townships.
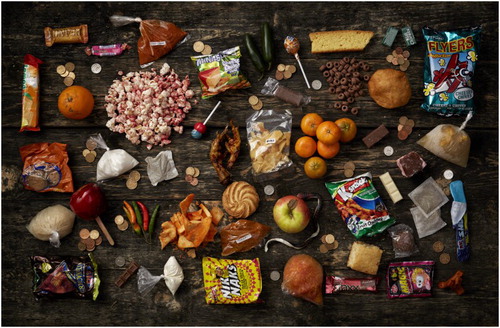
Figure 1. R1 (US$0.08) food items available from informal food retailing outlets in Delft South (2015). Source: Image composed and taken by Justin Patrick (www.justinpatrick.co.za).