Figures & data
Table 1. Number of supermarkets, ownership and % share in each country (formal chain stores only), 2016.
Figure 1. Proportion of urban population, 2000–15. Source: United Nations, Department of Economic and Social Affairs, Population Division (2014). World Urbanization Prospects: The 2014 Revision.
Figure 2. GDP per capita (current US$), 2000–15. Source: World Bank, World Development Indicators.
Table 2. GDP growth rates, 2000–15.
Figure 3. Shoprite and Pick n Pay’s SA and non-SA supermarket sales and profits, 2010–16. Source: Shoprite and Pick n Pay Annual Reports.
Note: The sales figures represented by bars are on the primary (left) axis, while the profit figures represented by lines are on the secondary (right) axis.
Figure 4. Trading margins of Shoprite and Pick n Pay, 2010–16. Source: Annual Reports.
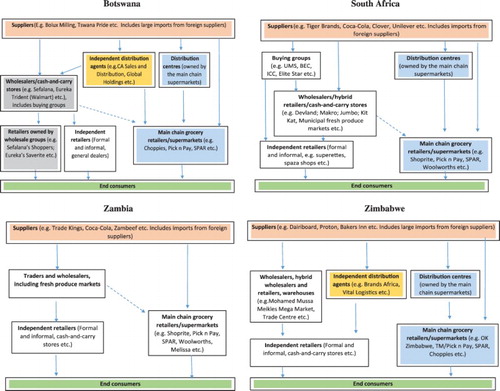
Appendix 1. Retail landscape – value chains for fast-moving consumer goods. Source: Author’s illustration