Figures & data
Figure 1. Map showing South African climate zones, water source areas, areas of high groundwater use and areas of mine water pollution (adapted from Ololade et al., Citation2017).
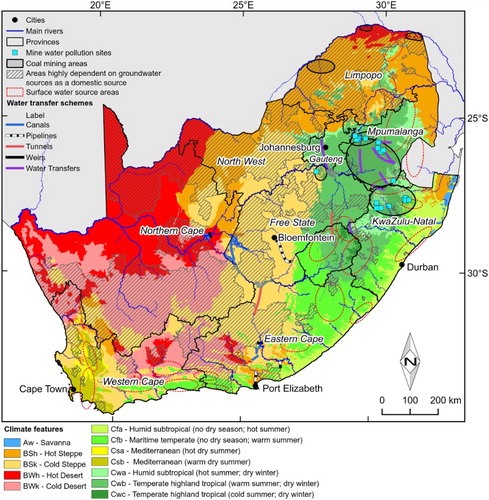
Figure 2. Energy–water nexus scenario in South Africa (adapted from Wang, Citation2009).