Figures & data
Figure 1. Shares of South Africa’s diversified manufacturing exports (excluding basic metals, coke & petroleum and basic chemicals) by destination. Source: Calculated from Quantec data.
Note: In 2010 there was an adjustment to better capture South Africa’s exports to other SACU countries, implying that the share from 2000 to 2009 had been understated while the adjustment accounts for a substantial proportion of the jump in the share of exports to SADC and Africa in 2010.
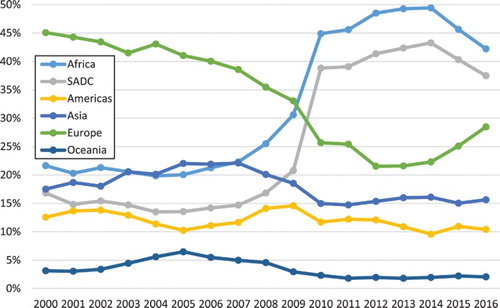
Figure 2. South Africa’s leading exports to SADC countries (excluding basic metals, coke & petroleum and basic chemicals) (US$). Source: Quantec.
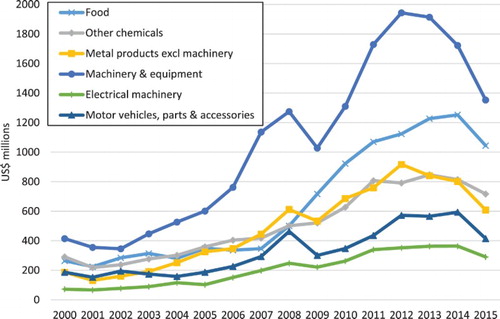
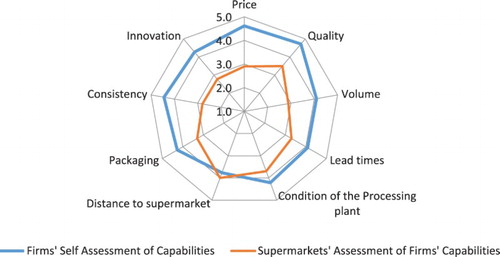
Figure 3. Suppliers and Supermarkets Assessment of Suppliers Capabilities. Source: Ziba and Phiri (Citation2017).