Figures & data
Figure 1. Trends in animal feed and poultry prices. Source: Poultry Association of Zambia; Zambia Central Statistical Office.
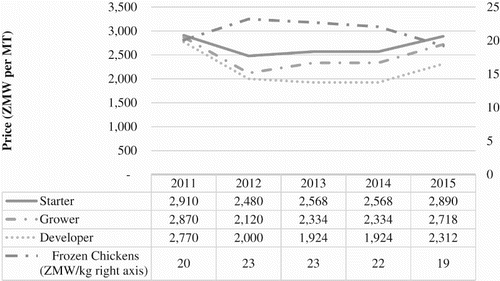
Figure 2. Zambia’s broiler value chain. Source: Authors.
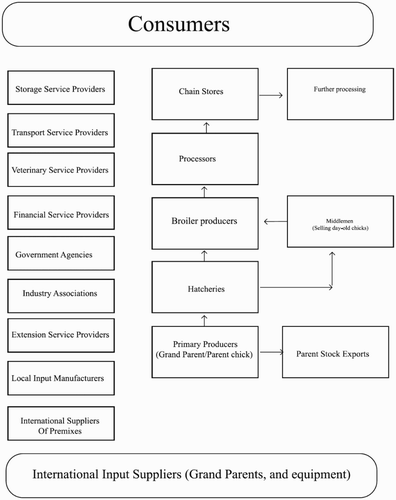
Table 1. Industry capacities.
Table 2. Trends in production of poultry and animal feed (2010–2014).
Figure 3. Zambia’s animal feed trade in US$ millions (2010–2014). Source: ITC (Citation2015).
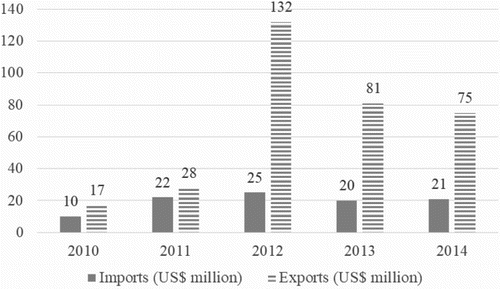
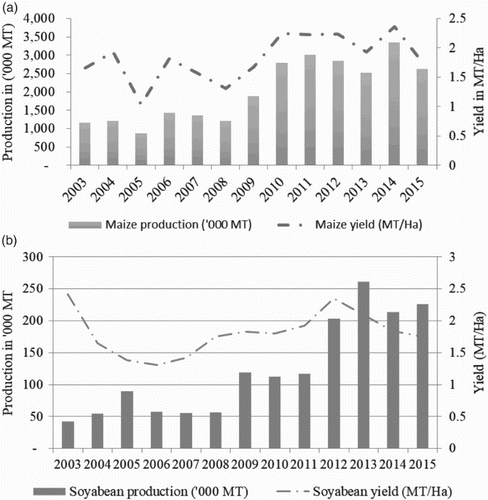
Figure 4. Trends in maize and soya bean yields and production.
Source: Central Statistical Office Crop Forecast Surveys (2003–2015).