Figures & data
Figure 1. Labour force participation rates by population group and gender, 1995–2016: (a) by population group; (b) by gender. Source: Own calculations using OHS 1995–1999, LFS 2000–2007 September, QLFS 2008–2015 Q4 and QLFS 2016 Q3 data.
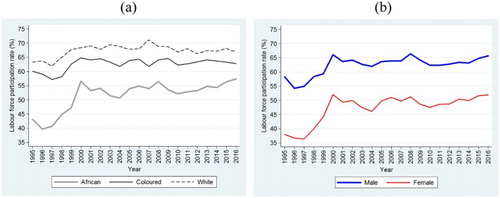
Figure 2. Unemployment rates by population group and gender, 1995–2016: (a) by population group; (b) by gender. Source: Own calculations using OHS 1997–1999, LFS 2000–2007 September, QLFS 2008–2015 Q4 and QLFS 2016 Q3 data.
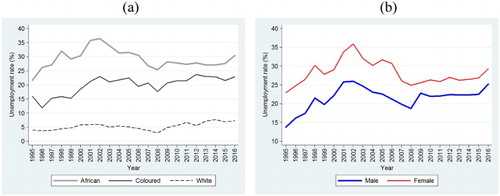
Figure 3. Probability of finding employment in formal non-agricultural sector, 1997–2016: (a) by population group; (b) by gender. Source: Own calculations using OHS 1997–1999, LFS 2000–2007 September, QLFS 2008–2015 Q4 and QLFS 2016 Q3 data.
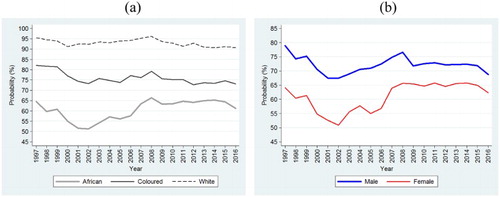
Figure 4. Probability of finding employment in high-skilled occupations, 1997–2016: (a) by population group; (b) by gender. Source: Own calculations using OHS 1997–1999, LFS 2000–2007 September, QLFS 2008–2015 Q4 and QLFS 2016 Q3 data.
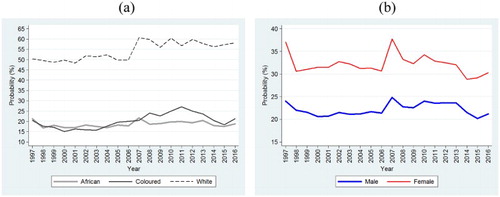
Table 1. Probit regressions on employment likelihood of labour force by population group, selected surveys.
Table 2. Probit regressions on employment likelihood of labour force by gender, selected surveys.
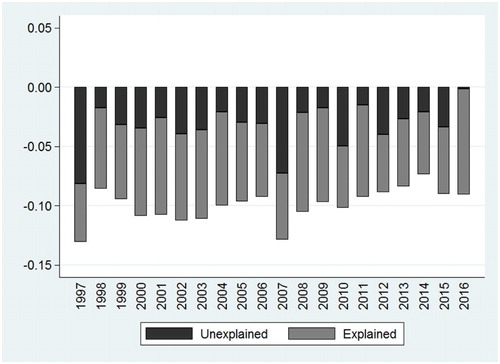
Figure 5. Decomposition of average white–African employment probability gap, 1997–2016. Source: Own calculations using OHS 1997–1999, LFS 2000–2007 September, QLFS 2008–2015 Q4 and QLFS 2016 Q3 data.
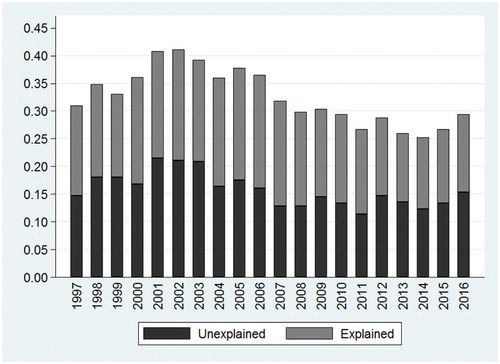
Figure 6. Decomposition of average white–coloured employment probability gap, 1997–2016. Source: Own calculations using OHS 1997–1999, LFS 2000–2007 September, QLFS 2008–2015 Q4 and QLFS 2016 Q3 data.
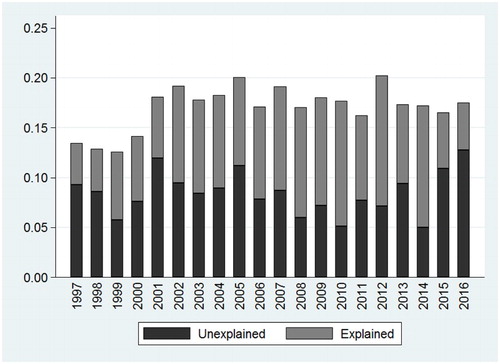
Figure 7. Decomposition of average male–female employment probability gap, 1997–2016. Source: Own calculations using OHS 1997–1999, LFS 2000–2007 September, QLFS 2008–2015 Q4 and QLFS 2016 Q3 data.
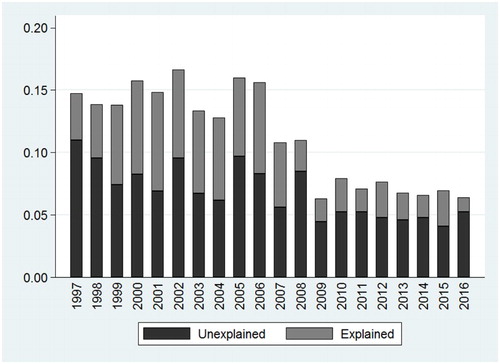
Table 3. Probit regressions on likelihood of employed involved in high-skilled occupations by population group, selected surveys.
Table 4. Probit regressions on likelihood of employed involved in high-skilled occupations by gender, selected surveys.
Figure 8. Decomposition of average white–African high-skilled occupational attainment differential, 1997–2016. Source: Own calculations using OHS 1997–1999, LFS 2000–2007 September, QLFS 2008–2015 Q4 and QLFS 2016 Q3 data.
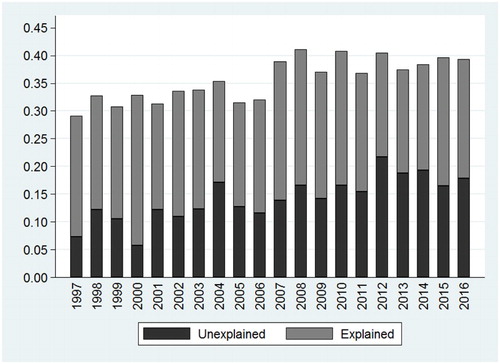
Figure 9. Decomposition of average white–coloured high-skilled occupational attainment differential, 1997–2016. Source: Own calculations using OHS 1997–1999, LFS 2000–2007 September, QLFS 2008–2015 Q4 and QLFS 2016 Q3 data.
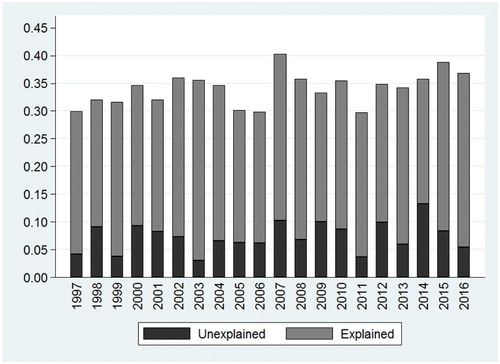
Figure 10. Decomposition of average male–female high-skilled occupational attainment differential, 1997–2016. Source: Own calculations using OHS 1997–1999, LFS 2000–2007 September, QLFS 2008–2015 Q4 and QLFS 2016 Q3 data.