Figures & data
Table 1. Demographic characteristics of the final sample (%).
Table 2. Educational, labour market and household characteristics of the final sample.
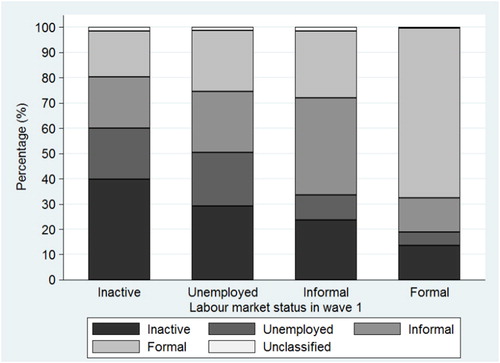
Figure 1. Labour market status transition between wave 1 and wave 4. Source: Own calculations using the NIDS data.