Figures & data
Figure 1. Framework for analysing the policy environment. Source: Foster & Heeks (Citation2015).
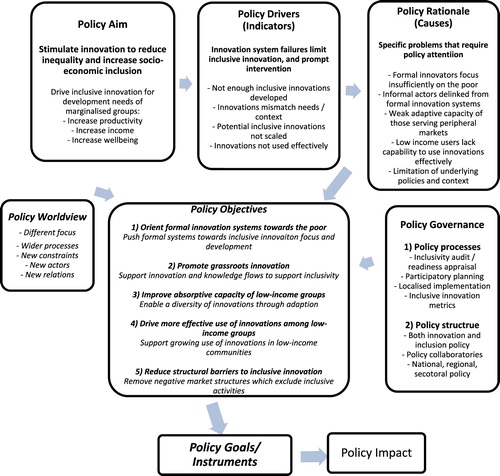
Table 1. Coding policy objectives and goals in terms of IID.
Figure 2. Word clouds on the key objectives for ‘innovation and development’ and ‘socio-economic inclusion and development’.
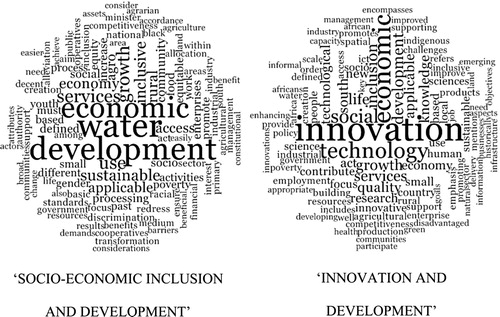
Figure 3. Venn diagram illustrating the main intersecting objectives of improved well-being, income and livelihoods, by department.
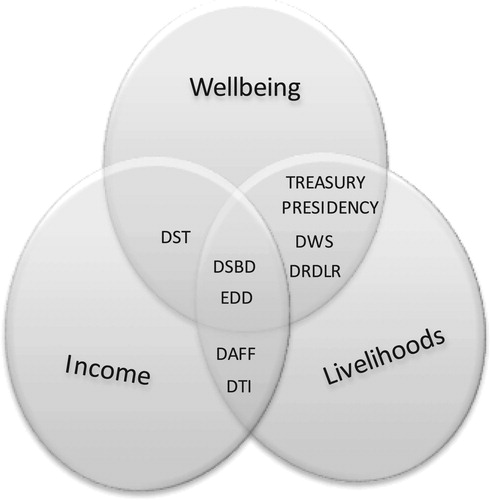
Figure 4. Proportion of policy instruments potentially significant for promoting grassroots innovation, by department.
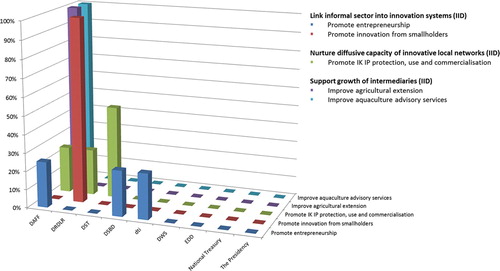
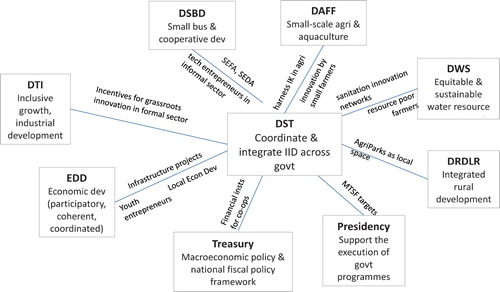
Figure 5. Spaces to deepen and extend policy alignment to promote grassroots innovation, towards IID.