Figures & data
Table 1. Major steps in the construction of composite indices.
Table 2. Statistical properties of the eight sub indicators that compose the CI.
Table 3. Risk dimension statistics.
Table 4. Factor loadings based on rotated principal components.
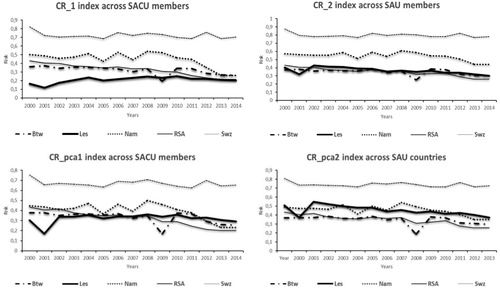
Figure 1. Differences between risk indices constructed using different aggregation and weighting procedures.