Figures & data
Figure 1. South African Trade Balance from 1960 to 2009. Noted Y axis are in millions of rands.
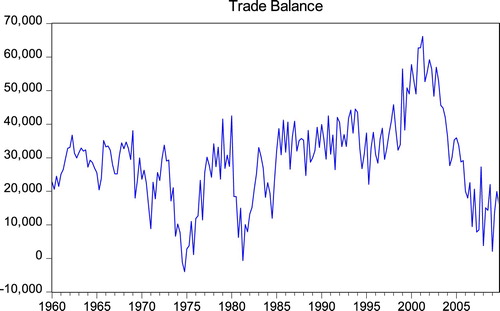
Figure 2. Export and Output Growth Rates from 1960 to 2016.
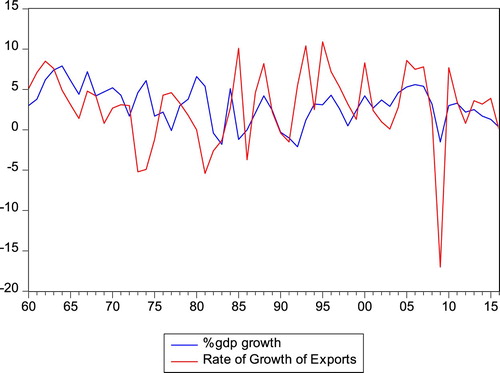
Figure 3. Growth Rate of the Real Exchange Rate.
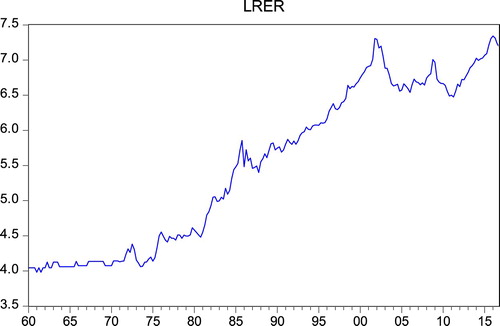
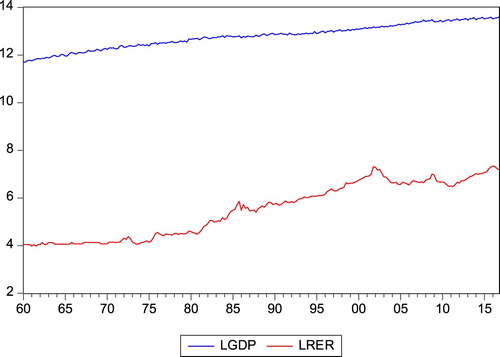
Figure 4. Real Exchange rate and Output movements.