Figures & data
Table 1. Empirical evidence of the relationship between globalisation and poverty reduction.
Table 2. Data sources and summary statistics.
Table 3. Variance inflation factor (VIF) results.
Table 4. Zivot and Andrews unit root test results.
Table 5. ARDL cointegration results and critical values.
Table 6. ARDL analysis results (lnHC): long and short run.
Table 7. ARDL analysis results (lnMR): long and short run.
Table 8. ARDL analysis results (lnLE): long and short run.
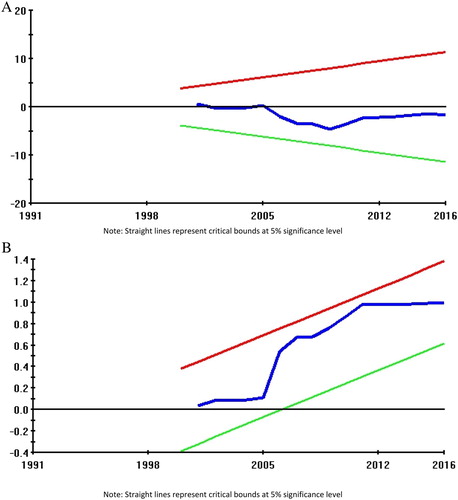
Figure 1. (A) Plot of cumulative sum of recursive residuals (Model 1). (B) Plot of cumulative sum of squares of recursive residuals (Model 1).
Note: Straight lines represent critical bounds at 5% significance level.
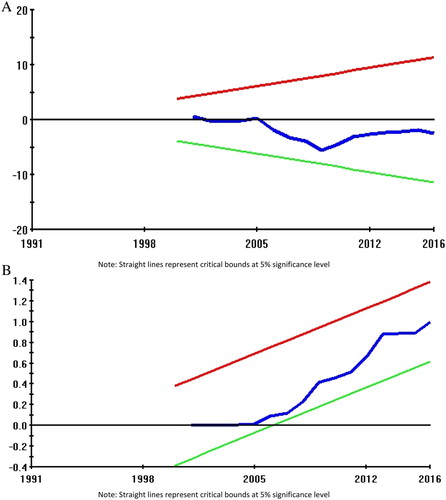
Figure 2. (A) Plot of cumulative sum of recursive residuals (Model 2). (B) Plot of cumulative sum of squares of recursive residuals (Model 2).
Note: Straight lines represent critical bounds at 5% significance level.
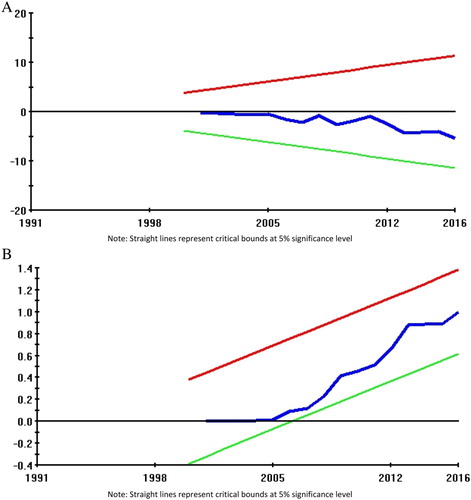
Figure 3. (A) Plot of cumulative sum of recursive residuals (Model 3). (B) Plot of cumulative sum of squares of recursive residuals (Model 3).
Note: Straight lines represent critical bounds at 5% significance level.