Figures & data
Table 1. Union membership in the South African education sector, 2012.
Table 2. Teacher strike activity by school wealth, SEACMEQ III 2007.
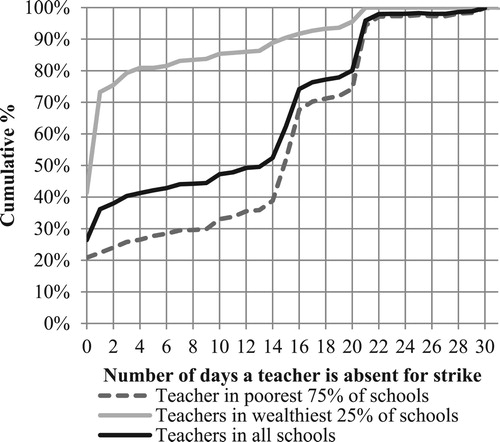
Figure 1. Cumulative % graph of teachers’ strike absenteeism by school wealth status, SEACMEQ III 2007.