Figures & data
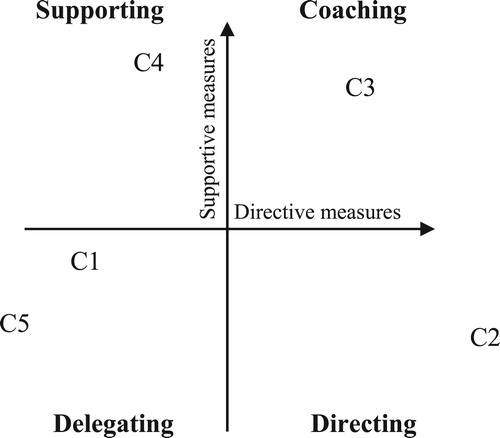
Figure 1. Four leadership styles as set out by the Situational Leadership Theory (elaborated from Hersey & Blanchard, Citation1969).
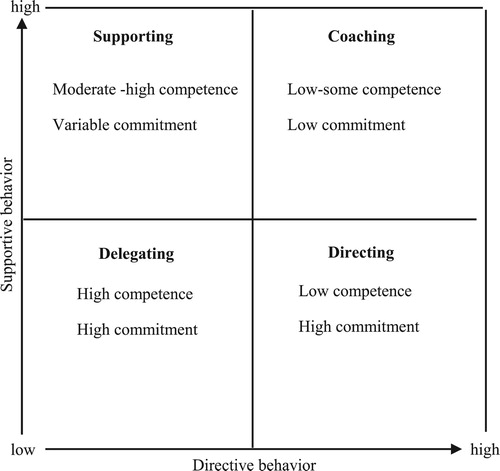
Figure 2. Radar chart showing how the different identified farm clusters score relatively in terms of each other for the discriminatory variables and compared to the average dairy holder.
Note: For each discriminatory variable, the relative scores were calculated by dividing the average value of each farmer cluster by the maximum observed value amongst all farmer clusters.
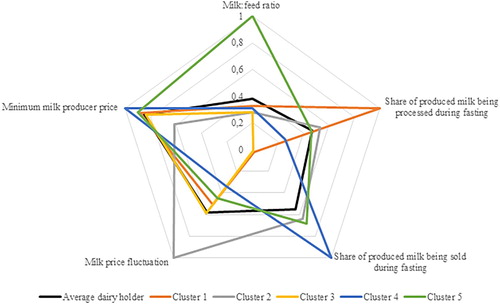
Table 1. Average values (mean ± SE) of the discriminatory variables used in the cluster analysis for the identified farmer clusters.
Table 2. Socio-demographic characterisation of the sampled dairy farming households and their heads: mean ± SE for the continuous variables and frequencies for the categorical variables.
Table 3. Characterisation of the dairy farm systems: mean ± SE for the continuous variables and frequencies for the categorical variables.
Figure 3. Average daily milk production and feed cost for the different identified farm clusters and the average dairy holder (indicated by the black line).
Table 4. Feeding practices within the identified farm clusters: mean ± SE for the continuous variables and frequencies for the categorical variables.
Table 5. Correlation matrix of marketing variables and fasting coping strategies.
Table 6. Milk use and fresh milk marketing strategies among the identified farm clusters: mean ± SE for the continuous variables and frequencies for the categorical variables.
Table 7. Short summary of the identified urban dairy systems.
Figure 4. Required intervention styles for the different identified farm clusters.