Figures & data
Figure 1. Income distribution in Southern Africa: Share of deciles in income distribution. Source: UNU-WIDER (Citation2017) for various years in each country – Angola (2008), Botswana (2009), Lesotho (2010), Madagascar (2012), Malawi (2010), Mauritius (2012), Mozambique (2008), Namibia (2010), South Africa (2011), Swaziland (2009), and Zambia (2010).
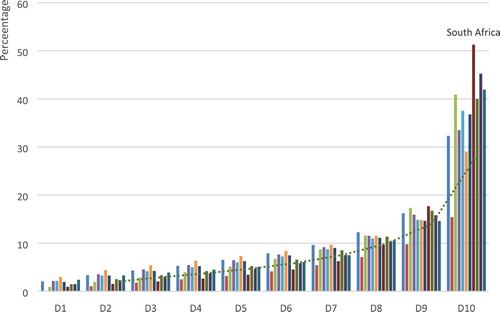
Figure 2. Gauteng province and its surroundings – forming the wider Gauteng city-region.
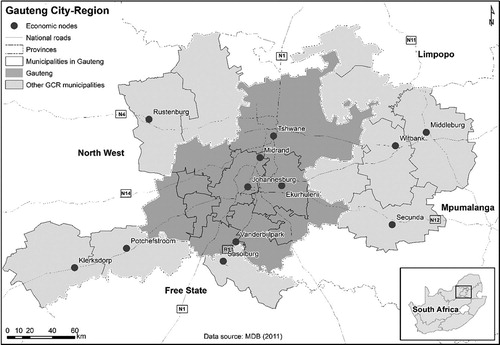
Table 1. Description of model variables.
Figure 3. Income distribution by quantiles in QoL IV survey data.
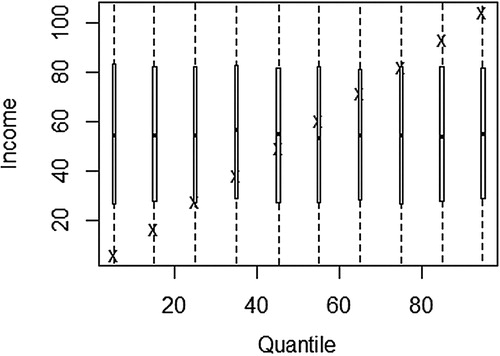
Table 2. Univariate statistics of model variables,
Figure 4. Per capita monthly income in Gauteng.
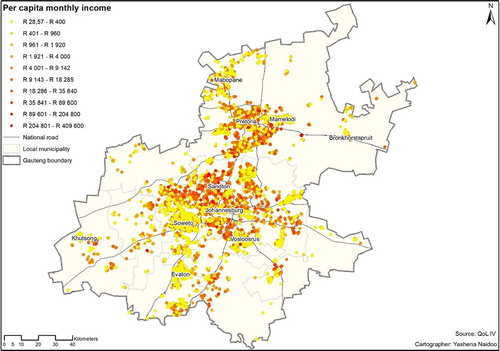
Table 3. Quantile regressions results.
Figure 5. Varying coefficients for race variables, with 95% confidence intervals. Blacks was the reference group.
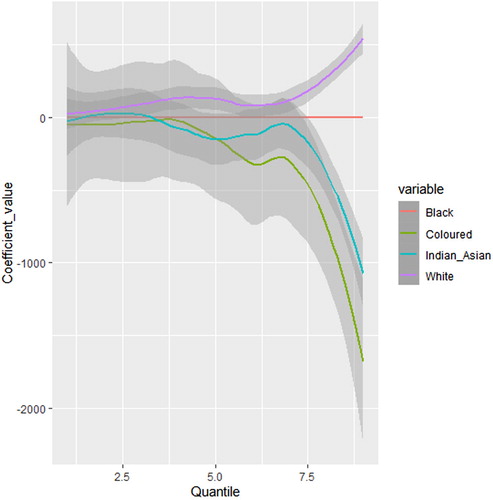
Figure 6. Quantile regression results for pensioners and youth compared to adult (reference group) – with 95% confidence intervals.
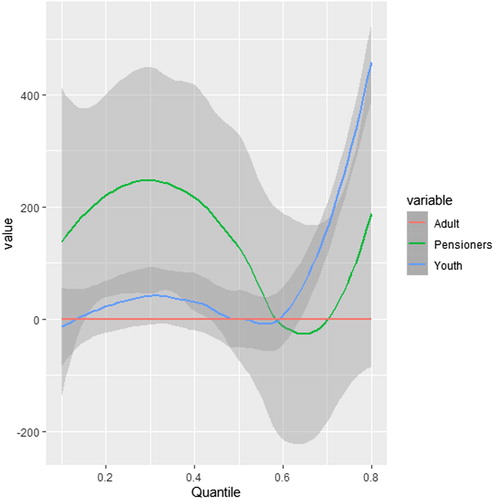
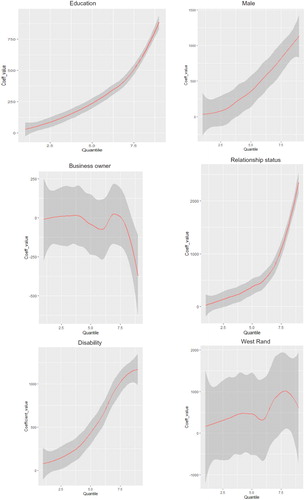
Figure 7. Varying estimate values for other selected explanatory variables (with 95% confidence intervals each).