Figures & data
Table 1. Average characteristics of the agricultural and retail sectors and their control groups.
Table 2. The number of observations across district councils for the agricultural and retail sectors, by firm size and time period.
Table 3. Average wage gaps for the agricultural and retail sectors.
Table 4. Probability of employment in the agricultural sector.
Figure 1. Median amount of capital in the agricultural sector by firm size. Source: Authors’ calculations using the SARS-NT panel for the 2011 tax year.
Notes: The SARS-NT panel only starts from the 2008 tax year, but figures are only reliable a few years into the dataset and thus, figures for the 2011 tax year are shown here. Amounts are shown in South African Rands.
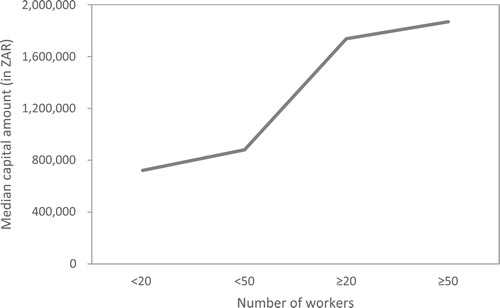
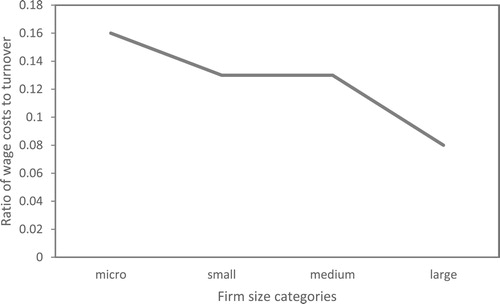
Figure 2. Median ratio of wage costs relative to turnover for the agricultural sector by firm size. Source: Authors’ calculations using the SARS-NT panel for the 2011 tax year.
Notes: Firm size categories are based on turnover measures comparable to those used in the Agricultural Survey in 2016.