Figures & data
Figure 1. Map showing Lake Itezhi-Tezhi fishery, Kafue National Park, and GMAs (Source: Authors).
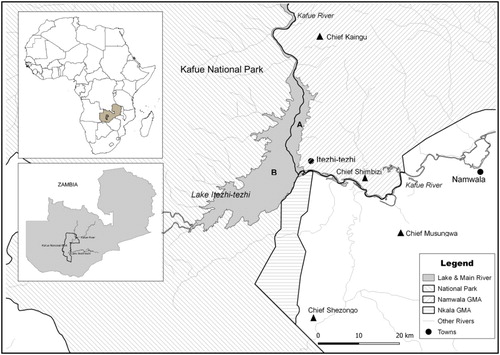
Figure 2. Sustainable Livelihood Framework (Source: DFID (Citation1999)).
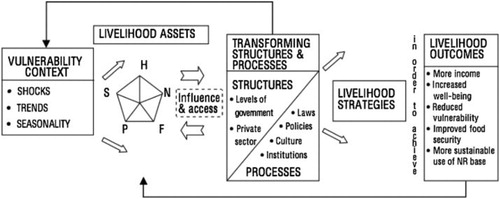
Table 1. Five livelihood assets or capacities.
Table 2. Composition of the strata for Lake Itezhi-Tezhi fishery.
Table 3. Characteristics of human assets in the fishing community (n = 451).
Figure 3. Number of household members involved in fishing-related activities (n = 577).
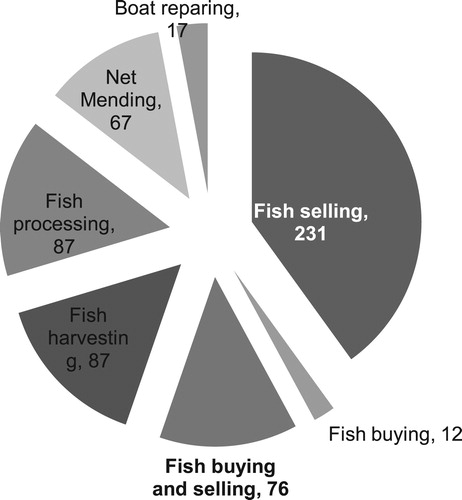
Figure 4. Number of household members involved in the fish selling business (n = 231).
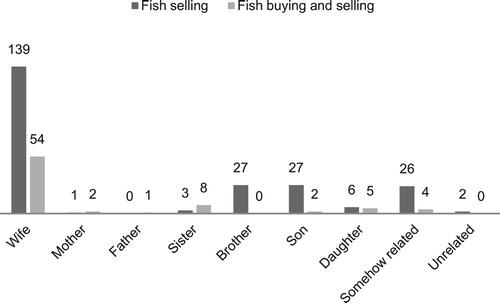
Figure 5. Percentages of fishers’ accessibility to social amenities within Lake Itezhi-Tezhi fishing community in relation to research strata.
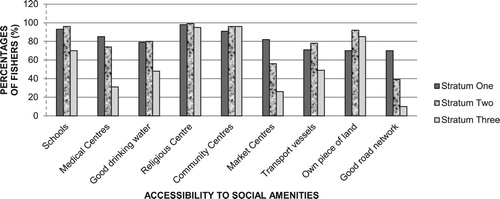
Table 4. Factors that influenced fishing income levels among fishers (n = 451; R2 = 0.06; p < 0.001).
Table 5. Percentages of fishers based on major income sources and income ranges.
Table 6. Ordinal logistic regression prediction of whether or not fishers’ ownership of physical assets was dependent on different levels of fishing income. Reference fishing income = more than $200; n = 451; * Significant (Sig.) at p < 0.05 or ** p ≥ 0.001, ns: Not significant at p ≥ 0.05.
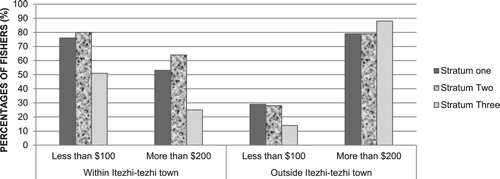
Figure 6. Preferred selling locations in relation to percentages of fishers’ fishing income levels in each research stratum.