Figures & data
Table 1. Main explanatory variable and control factors used in fixed effects multivariate regression.
Table 2. Selected characteristics of females aged 15–24, Ethiopia, Rwanda and Zimbabwe, 2005/06, 2010/11 DHS.
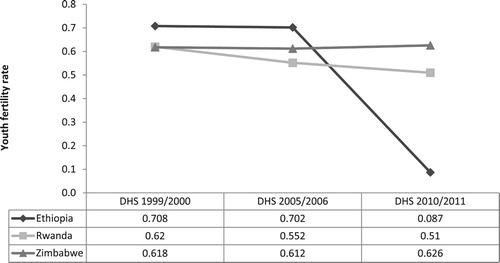
Figure 1. Trends in youth fertility in Ethiopia, Rwanda and Zimbabwe, 1999/2000 to 2010/2011.