Figures & data
Table 1. Dimensions of underemployment.
Table 2. Demographic and educational attainment characteristics of the waste pickers (%).
Figure 1. Reason why the waste pickers left their last job, if they ever worked in a job that involved the receipt of a pay slip.
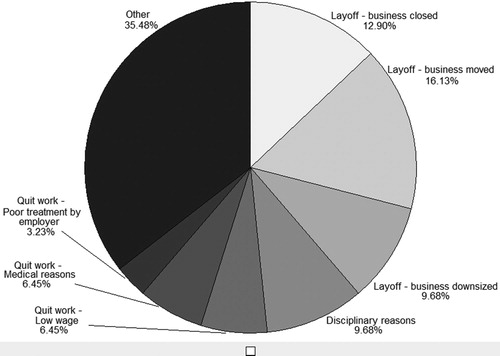
Figure 2. Reason why the waste pickers decided to collect recyclable waste.
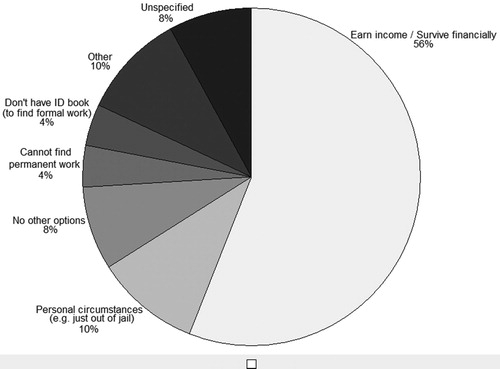
Photo 1. Examples of adapted supermarket trolleys.
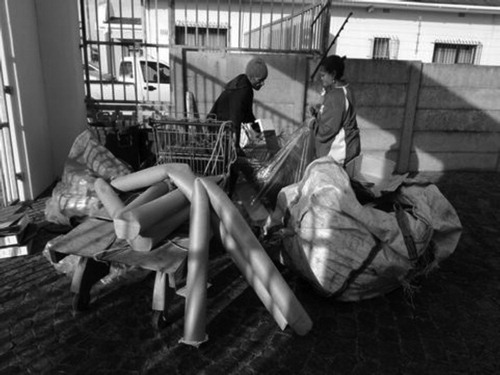
Photo 2. Example of a homemade trolley.
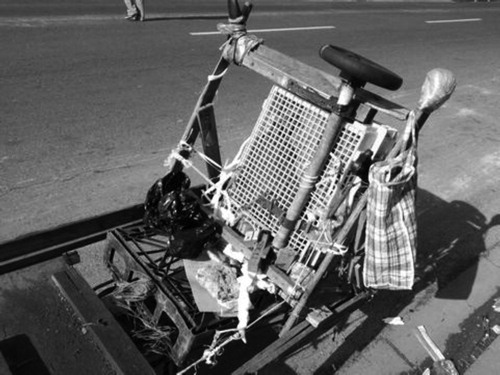
Table 3. Work activities of the waste pickers (%).
Figure 3. Where the waste pickers found the waste (more than one option could be declared).
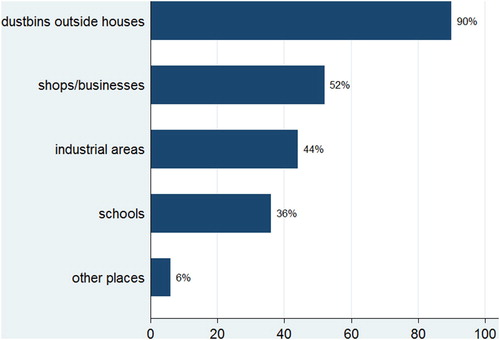
Figure 4. Type of recyclable waste collected by the waste pickers (more than one option could be declared).
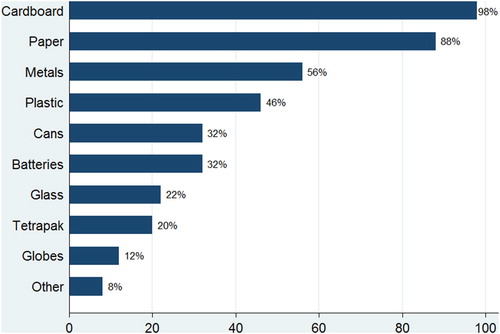
Table 4. Use of trolleys by waste pickers (%).
Figure 5. (a) Distribution of usual daily income of waste pickers (2016 December prices). (b) Distribution of log usual daily income of waste pickers (2016 December prices).
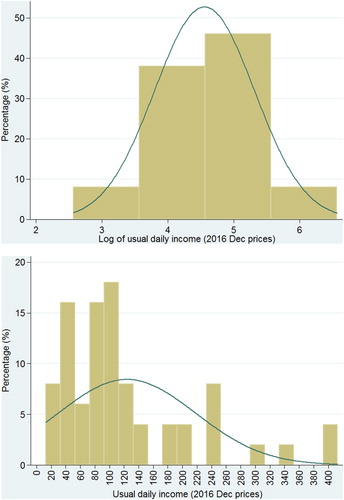
Table 5. Daily income of the waste pickers (2016 December prices).
Figure 6. Actual income compared to expected income.
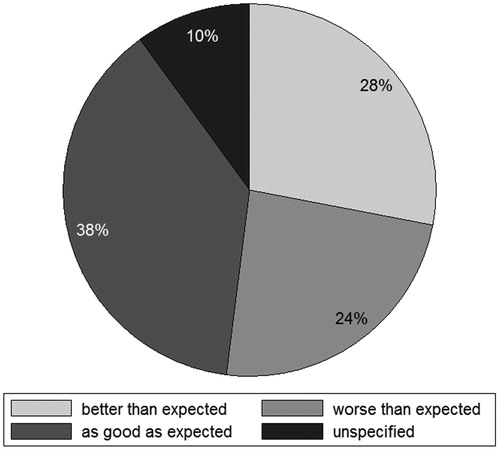
Table 6. Other information on the waste pickers (%).
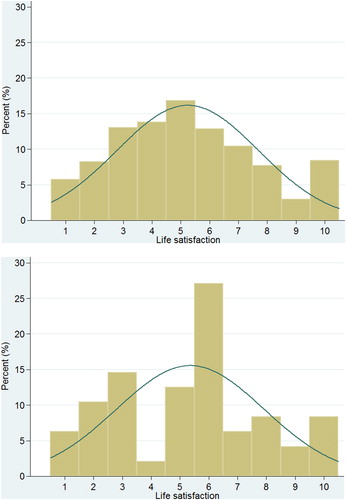
Figure 7. (a) Distribution of life satisfaction of waste pickers. (b) Distribution of life satisfaction of informal self-employed in elementary occupations, NIDS2016.